EVALUATION OF MASS MARKET DEVICES FOR THE DOCUMENTATION OF THE
CULTURAL HERITAGE
I. Aicardi a, A. Lingua a, M. Piras a
a
Politecnico di Torino, DIATI – Department of Environmental, Land and Infrastructure Engineering, Torino, Italy – (irene.aicardi – andrea.lingua – marco.piras)@polito.it
Commission V, Symposium 2014
KEY WORDS: Calibration, Crowdsourcing, Cultural heritage, Mass-market sensors, Photogrammetry, Smartphone
ABSTRACT:
The cultural and artistic heritage has always been at the center of activities aimed at its preservation and enhancement. Italy is a country particularly rich in terms of heritage to be protected, where the high-risk due to natural hazard, as earthquakes, landslides and floods, which are adds to human activities, contribute to make the heritage more frail, land needs to be safeguarded and enhanced and new mass market technology can be considered as innovative tools for the documentation of cultural heritage. In order to increase our country on the artistic point of view, it must be known in an historical and cultural way. Moreover, it is important also to define the cultural heritage on metric terms, to be able to describe and represent it with the best approach, with the purpose to offer to the people who comes to visit our beautiful country, the reliable model of some important object, that is no longer in exposition.
The possibility to use the mass-market devices can allow us to realize it, because they are available for the greater part of the visitors, in a photogrammetric way to reconstruct our models.
In the last years, these devices have been very improved and the embedded sensors are becoming more and more efficient in terms of precision and reliability. Also several small video cameras are now used to document our travels and activities and to share them through Internet.
In this scenario, the aim of this research is to study and validate the possibility to use mass-market technology for this purpose, testing four different devices (smartphones and video cameras) for the documentation of the cultural heritage.
1. INTRODUCTION
“Most of the world’s significant sites have been photographed under many different conditions, both from ground and from the air” (Seith et.al, 2008).
In the last years, the possibility to use data acquired from smartphones and mini video cameras is becoming relevant because we are all gifted and in our travels and in our daily activities, even unintentionally, we acquire data that could potentially be able to contribute to the documentation of the heritage of the country (Brown et al., 2005) (Debevec et al., 1996).
The modern devices include several sensors which are usually adopted for Geomatics applications, such as digital camera and GNSS receivers, even inertial platform based on gyroscopes, accelerometers and magnetometers and RFID system for smartphone devices (Piras et al., 2014).
The potential performance of these sensors could extend the rule of the users in the heritage documentation activities, as it already exist, for example, in crowd-mapping applications. In fact, a very big number of images of large parts of the world and most famous monuments under many different viewing conditions are now available on the web thanks to Internet and the possibility that the users have to share the data.
Nowadays, there are many possibilities for the users to get their own model of a specific object. In fact, they can employ user-friendly software, which can be used also by people that are not very skilled in photogrammetry, or they can upload their images on the web (for example using Autodesk 123D Catch) and receive the 3Dmodel by e-mail (Vergauwen et al., 2006).
The involvement of the users and their curiosity in these applications are becoming very important, so our purpose in this
paper is to test the quality of the acquired data and the results that can be achieved using some low-cost sensors on the shelf (Chandler et.al, 2005).
2. SENSORS CALIBRATION
The most popular sensors today available on the market and widely used have been considered in this research. Specifically, smartphones and mini video cameras falling in the category of the mass-market sensors have been investigated. The technical characteristics of each used sensor, that has been extracted from technical specifications or knowing the size of the sensors and images, are described in Table 1:
Model
Samsung Galaxy S Advance
iPhone4 Go Pro Hero2
Contour Plus2
Categ. Smartphone Smartphone Video camera
Video camera Cost
[€] ~ 170 ~ 400 ~ 200 ~ 400
Focal length [mm]
4,310 3,850 4,300 3,000
Pixel dim. [µm]
1,75 2,45 1,40 4,50
Image dim. [pixel]
1920x2560 1936x2592 1920x1080 1280x960
Table 1. Devices and their principal characteristics The International Archives of the Photogrammetry, Remote Sensing and Spatial Information Sciences, Volume XL-5, 2014
The used devices include cameras/video cameras integrated, which are non-metric sensors, so they require a calibration through an analytical procedure in order to study the characteristics of the mechanical-digital distortion parameters and to evaluate other errors attributable to them.
To use these devices for photogrammetry and 3D modeling conveniently burnished having a spherical surface; the centre of curvature of each portion of sphere is located on a straight line also called lens optical axis. Thanks to its spherical shape, it is possible to deviate ray light flowing through lenses.
A real photogrammetric lens has significant differences with respect to the ideal one because:
the lens assembly misalignment;
the photogrammetric reference axis will not be the optical axis OA, but a principal calibrated that, in the object space, is perpendicular to the image plane;
the refractive and incidence angles do not match;
the main distance is slightly different from the main optical distance;
the image plane is not perfectly perpendicular to the optical axis.
At the end, the principal distance variation (Δc) is calculated, trying to lead the mean value to zero.
These distortion curves could be represented in a table form or in a ρ odd degree polynomial form: substantially static in terms of geometry. However there exist a distortion effect related to the geometry of the sensor: in theory a pixel should be a perfect square and the rows matrix should be perpendicular to the columns; in reality this does not happen. Such distortion is time constant, depends only on sensor construction, and is conveyed by a particular affine transformation:
(6)
(7)
So, using mass market devices is important to make the sensors calibration in order to know and model these parameters. In particular, in our case, we consider only the radial distortion which is the most relevant parameter to know in order to use the images in a correct way.
The analytical calibration mode of the cameras (Clarke, 1998) are usually divided into on-the-job calibration and
self-calibration, which are based on the solution of the calculation of a bundle-adjustment performed considering as unknowns the six external orientation parameters of the images and the six parameters of the camera calibration (ξ0, η0, c, K1, K2, K3) (Kraus, 1997).
In this application, the self-calibration procedure has been used.
This is based on the determination of the calibration parameters carried out independently by the procedures of the photogrammetric survey. This method is usually performed by preparing a calibration grid, specifically made, in which the coordinates of the target are known with extreme precision (Remondino, 2006).
The camera calibrations have been carried out using a special calibration field, which is externally materialized of the Geomatics Laboratory of the Politecnico di Torino (Figure 1), in which there are a lot of square markers (8 cm) identified by a serial number.
Figure 1. Calibration field for lens and sensors distortions
The software Leica Photogrammetric Suite (LPS) suite of ERDAS has been used for the self-calibration of the device. The procedure requires to insert at least two images, which have unknown internal orientation parameters, and collimate the corresponding points to solve the problem adopting a smartphones is reported in Figure 2 and Figure 3:
Figure 2. Results of radial lens distortions of Samsung calibration
Figure 3 - Results of radial lens distortions of iPhone calibration
As it is possible to notice, the iPhone has the radial distortion that is four times bigger than the Samsung smartphone and, correcting the parameters with the linear trend, its distortion is about twice then the other one.
Instead, for the video cameras we acquired a video of the object of interest (Akbarzadeh et al., 2006) and then, using Matlab, we are able to extract all the frames and select only a few of them in order to perform the calibration.
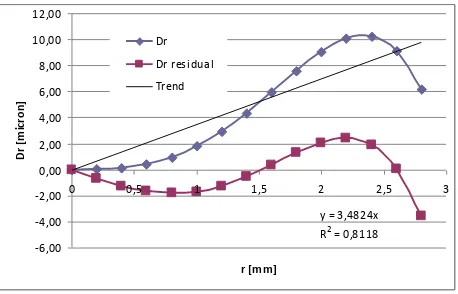
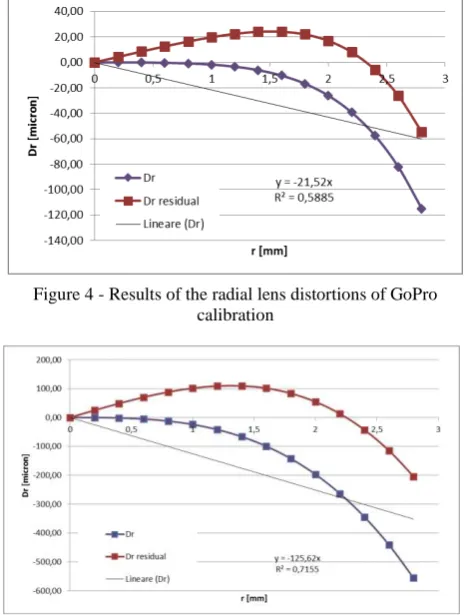
The results obtained with these devices are shown in Figure 4 and Figure 5:
Figure 5 - Results of radial lens distortions of Contour calibration
The video cameras results are more different with respect to results obtained with the smartphones. It is possible to notice that the distortions are not negligible for a photogrammetric purpose and, especially for the Contour, they can reach values about 0.5 mm if the correction of the linear trend is not apply.
Moreover, it was very difficult to make a self-calibration of the video cameras because their big distortion have made the system very unstable and any small change in the tie and control points could make the final result vary too much.
In Table 2, the calibration results are summarized in order to have an overview of the radial distortion and the internal orientation parameters.
Samsung iPhone4 Go Pro Hero2
Contour Plus2
c [mm] 4,3099 3,8700 4,5069 3,7615
ccor [mm] 4,3249 3,9017 4,4099 3,2890 ξ0 [mm] 0,0868 -0,0162 -0,9064 -0,6031
ƞ0 [mm] 0,0704 -0,0359 2,0577 1,1397 k1 2,01E-03 2,01E-03 -1,20E-03 -2,38E-02
k2 -2,21E-04 -1,00E-04 -5,15E-04 -1,92E-04
rmax[µm] -3,6 -6,6 -54,7 -204,1
Table 2 - The calibration results
We have calibrated the devices before to make the tests and knowing the results we can say that before using them it is better to always make a new calibration because, probably, these parameters are not stable over the time.
After the calibration procedure, we can perform some tests in order to evaluate the results obtainable using these devices.
3. SOME RESULTS ON A PRELIMINARY TEST
The tests were carried out on a small volume using a cardboard box of dimensions 47x27x30 cm.
The analysis of geometric precision and congruence were made with a reference model obtained using a laser scanner technology. The survey has been made with the laser scanner Faro Cam 3D and the data have been processed using the owner software called Scene v 5.2. This allowed us to assess the quality and accuracy of the data and the results obtained through the use of photogrammetry.
Only considering the smartphone Samsung, the cardboard has been covered by 27 images (71 MB) that were processed using the software PhotoScan to obtain a 3D point cloud (ASPRS, 1989).
At the end of the process, the point cloud generated from photographic images has been compared with the cloud defined using laser scanner. This comparison has been realized by means the software Cloud Compare (Figure 6) to evaluate the discrepancies.
Figure 6. 3D point clouds Comparison
y = 8,179x
R2 = 0,8708
-10,00 -5,00 0,00 5,00 10,00 15,00 20,00 25,00 30,00 35,00 40,00
0 0,5 1 1,5 2 2,5 3 3,5 4 4,5
r [mm]
D
r
[m
ic
ro
n
]
Dr
Dr residual
Lineare (Dr)
Figure 4 - Results of the radial lens distortions of GoPro calibration
Figure 7. Histograms comparison of the point clouds
In Figure 7 it is possible to notice that the point cloud discrepancies are less than:
7 mm for the 90 % of compared points;
20 mm for the 99 % of compared points.
So the photogrammetric point cloud is a useful data. The process was followed in order to test the procedure before carry out the analysis on a more complex element.
4. CASE STUDY: A CAPITAL
After the pre-analysis with a simple element, the procedure has been used to realize a model for a more complex component. In particular a capital available at our Geomatics laboratory has been adopted (Dick et al., 2004).
This item has been specially chosen because its geometric structure is rather complicated. So our aim is to verify the goodness of the models obtainable from that devices in the reconstruction of the geometry.
To make this, we acquired a set of photos with the smartphones (Grzeszczuk et al., 2002) and two videos using the video cameras. In these last cases the images are extracted from the videos trough the Matlab procedure in a “.tif” format.
Also in these cases, to generate the model we use the software PhotoScan. The decision for this solution was made in order to simulate a common user that want to make a model with its photos. Analyzing the solutions now present on the market, for us PhotoScan is the best mode to get a good results in a very simple way.
There are other software, such as MicMac, that can make a more sophisticated model, but they are not easy to use for the users that are not skilled in photogrammetry.
In our application, this workflow has been used:
1. photos alignment: the first pass is made to generate a 3D point cloud from the images trough a bundle block adjustment;
2. box reduction: the images acquired also data that are out of the object of interest. So, if we want only the subject there is the possibility in the software to mask the other parts of the images, but it requires more time, or to reduce the box to be analysed around the object.
It is important to say that sometimes the masks are necessary in order to get a model. In fact, as it is specify later, in the presented case of the video cameras we were not able to perform a correct bundle block adjustment without the insertion of the masks;
3. model construction: that is a triangulation of the point cloud in order to interpolate it and make the mesh; 4. texture application: the software gives also the
possibility to apply the images colour to have a 3D coloured point cloud (and mesh).
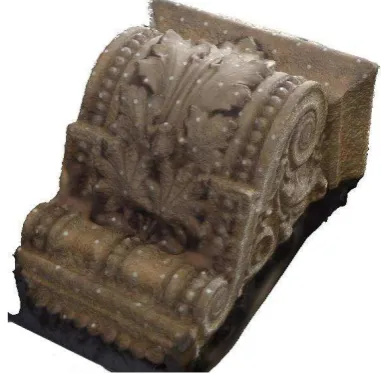
An example of the mesh obtained is shown in Figure 8 and the relative textured model in Figure 9.
Figure 8 - Mesh of the iPhone point cloud
Figure 9 - Textured mesh of the iPhone point cloud
The four models generated were different in terms of number of points and precision of the mesh. In Table 3 the data about the four devices are reported.
Samsung iPhone4 Go Pro Hero2
Contour Plus2
Photos 26 33 150 119
Points 6683 9190 14957 8775
Faces 6429167 10901706 2981021 1821502 Vertices 3214932 5451137 1490854 910954
Dim [MB] 268 436 124 76
Table 3 - Mesh and point clouds data
We have to specify that with the images of the smartphones we automatically get a 3D model of the object, but with the video cameras (Pollefeys et al., 2004), especially with the Contour, The International Archives of the Photogrammetry, Remote Sensing and Spatial Information Sciences, Volume XL-5, 2014
the software was not able to perform an acceptable bundle block adjustment, probably due to the large distortions of the sensor. In this case, a pre-processing of all the images has been realized, in order to mask all the parts that do not belong to the capital. This step has required about 1 hour and it is a problem for the users who want to automatically and quickly get a 3D model.
Data processing has been realized with a portable PC with Windows8 Pro x64, Intel Core i7, 8 GB of RAM. The data process has been required about 5-6 hours for the smartphones models and 6-7 hours for the video cameras.
5. THE VALIDATION OF THE RESULTS
The photogrammetric results were compared to a LiDAR model acquired using the Faro Cam 3D. In the case, 4 scans have been realized, in order to have a complete model of the object that we assume as the best reference for the comparisons, and the point cloud were processed using the software SCENE v 5.2. Small circle targets has been considered in order to get a single model of the object; that target were previously attached on the capital for laser surveying.
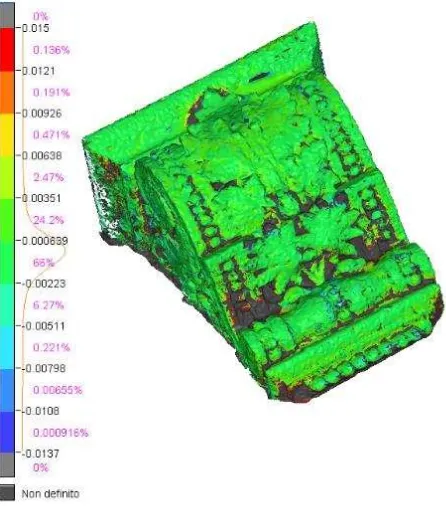
The meshes comparison has been realized using the package 3DReshaper. Cloud Compare was also used, but the software has given problems in data management (data was too big). Any reference system was considered, so in 3DReshaper the meshes were scaled and aligned respect to the laser one. Comparisons between each photogrammetric mesh and the laser model have been performed (an example is shown in Figure ):
Figure 10 - Comparison between laser model and iPhone meshes
The software create for each analysis an histogram of the differences between the two models, which are all reported in Figure 11:
Figure 11 - Histograms of the comparisons. Starting from the left are reported the results between the laser model and: iPhone, Samsung, GoPro and Contour.
For the comparisons, the maximum difference boundary between the two meshes has been settled about 1.5 cm, so the parts over this limit were not considered because they were considered as gross errors.
Analysing the histograms we can notice that most of the sides of the models have very little differences respect to the reference model and, in particular, we can summarize the obtained results in Table 4:
Samsung [%]
iPhone4 [%]
Go Pro Hero2
[%]
Contour Plus2
[%]
D <3
[mm] ~ 81,20 ~ 90,20 ~ 75,90 ~ 61,70
3< D <9
[mm] ~ 18,35 ~ 9,43 ~ 23,28 ~ 33,82
9< D <15
[mm] ~ 0,40 ~ 0,33 ~ 0,72 ~ 4,43
D >15
[mm] ~ 0,05 ~ 0,04 ~ 0,10 ~ 0,05
Table 4 – Percentage of differences between the laser mesh and the other ones
The best model was created using the iPhone device that is very closest to the laser model and the other meshes have a little big errors between 3-9 mm respect to the reference model.
But it is also important to notice that the number of points used to make the comparison is different for each device, as it is shown in Table 3. Therefore, the percentages shown in Table 4 refer to a different number of points, but is still significant compared to the entire model.
6. CONCLUSIONS
The obtained results demonstrate that the tested sensors can be employed to acquire images which can be used to realize 3D models and, especially with the smartphones, it is possible to achieve good accuracy.
The images acquired with these sensors, both smartphones and video cameras, have resolutions lower than those typically acquired for photogrammetric purposes, so to get a good result, it is necessary to increasing the number of shots and the locations of acquisitions.
In particular for the video cameras, it is necessary to enhance the processing step of the images because, as we had tested, the software is not able to generated the models in an automatic way.
This is probably due to the major distortions of these devices with respect the distortion of the devices embedded in the smartphones, In particular the Contour has a GPS integrated, which can offer also a positioning information.
For video cameras devices the lenses characteristic is that the distortions increase as you move away from the object center, so that aspect must be taken into consideration when building a 3D model using these video cameras.
It is very crucial to estimate in the best way the distortions and monitoring them over the time, because they are no-metric sensors and probably the calibration parameters are not stable along the time (Pollefeys et al., 1999).
7. ACNOWLEGMENTS
This project was carried out thanks to funding from the PRIN, Research programs of national interest named “Tecniche geomatiche innovative ed emergenti di rilievo, telerilevamento (da aereo, satellite, UAV) e WEBGIS per la mappatura del rischio in tempo reale e la prevenzione del danno ambientale” (person in charge: Prof. Santamaria, Università Partenope, Napoli, person in charge of local unit of Politecnico di Torino: A. Lingua).
8. REFERENCES
Akbarzadeh A., Frahm J.-M., Mordohai P., Clipp B., Engels C., Gallup D., Merrell P., Phelps M., Sinha S., Talton B., Wang L., Yang Q., Stewenius H., Yang R., Welch G., Towles H., Nistér D., Pollefeys M., 2006. Towards urban 3D reconstruction from video. In Proceedings of the international symposium on 3D data processing, visualization, and transmission
ASPRS, 1989. Non-topographic photogrammetry. 2nd edition, ISBN 0-944426-10-7
Brown M., Lowe D. G., 2005. Unsupervised 3D object recognition and reconstruction in unordered datasets. In Proceedings of the international conference on 3D digital imaging and modelling (pp. 56–63)
Chandler J., Fryer J.G., Jack A., 2005. Metric capabilities of low cost digital cameras for close range surface measurement. The Photogrammetric Record
Clarke T.A., Fryer J.G., 1998. The development of camera calibration methods and models. The Photogrammetric Record
Debevec P. E., Taylor C. J., Malik J., 1996. Modeling and rendering architecture from photographs: a hybrid geometry-
and image based approach. In SIGGRAPH conference proceedings (pp. 11– 20)
Dick A. R., Torr P. H. S., Cipolla R., 2004. Modelling and interpretation of architecture from several images. International Journal of Computer Vision, 60(2), 111–134
Grzeszczuk R., 2002. Course 44: image-based modeling. In SIGGRAPH
Kraus K., 1997. Photogrammetry II, Advanced methods and applications. Ummler/ Bonn, ISBN 3-427-78694-3
Piras M., Dabove P., Lingua A.M., Aicardi I., 2014. Indoor Navigation Using Smartphone Technology: A Future Challenge Or An Actual Possibility? In 2014 Plans Conference proceedings. In press.
Pollefeys M., Koch R., Van Gool L., 1999. Self-calibration and metric reconstruction in spite of varying and unknown internal camera parameters. International Journal of Computer Vision, 32(1), 7–25
Pollefeys M., Van Gool L., Vergauwen M., Verbiest F., Cornelis K., Tops J., Koch R., 2004. Visual modeling with a hand-held camera. International Journal of Computer Vision, 59(3), 207–232
Remondino F., Fraser C., 2006. Digital camera calibration methods: considerations and comparisons. ISPRS Commission V Symposium 'Image Engineering and Vision Metrology’ – IAPRS Volume XXXVI
Seith S., Snavely N., Szeliski R., 2008. Modeling the World from Internet Photo Collections. In: International Journal of Computer Vision, Vol. 80, pp.189-210
Vergauwen M., Van Gool L., 2006. Web-based 3D reconstruction service. Machine Vision and Applications, 17(2), 321–329.