AN APPROACH TO EXTRACT MOVING OBJECTS FROM MLS DATA
USING A VOLUMETRIC BACKGROUND REPRESENTATION
Joachim Gehrungab∗, Marcus Hebela, Michael Arensa, Uwe Stillab
a
Fraunhofer Institute of Optronics, System Technologies and Image Exploitation IOSB, 76275 Ettlingen, Germany - (joachim.gehrung, marcus.hebel, michael.arens)@iosb.fraunhofer.de
bPhotogrammetry and Remote Sensing, Technische Universitaet Muenchen, 80333 Muenchen, Germany - [email protected]
KEY WORDS:Volumetric Representation, Background Subtraction, Detection and Tracking of Mobile Objects, Change Detection
ABSTRACT:
Data recorded by mobile LiDAR systems (MLS) can be used for the generation and refinement of city models or for the automatic detection of long-term changes in the public road space. Since for this task only static structures are of interest, all mobile objects need to be removed. This work presents a straightforward but powerful approach to remove the subclass of moving objects. A probabilistic volumetric representation is utilized to separate MLS measurements recorded by a Velodyne HDL-64E into mobile objects and static background. The method was subjected to a quantitative and a qualitative examination using multiple datasets recorded by a mobile mapping platform. The results show that depending on the chosen octree resolution 87-95 % of the measurements are labeled correctly.
1. INTRODUCTION
Most of todays mobile mapping systems apply active laser scan-ners in addition to camera systems to supplement dense 3D en-vironment data. The mobile laser scans generated by such sys-tems are usually of high accuracy and more detailed than airborne laser scans, which makes them suitable for change detection in ur-ban environments, as it is required for the automatic detection of changes in public road space. The task of long-term change de-tection benefits from the removal of all measurements associated with mobile objects (e.g. cars, persons), so that only the static structures of interest remain. A first step into that direction is to remove moving objects, which are the easiest to identify class of mobile objects. During this step, both moving objects and the remaining background should be preserved. The latter one is of further interest for the modeling process and the former can be utilized to characterize, recognize and remove non-moving in-stances of these mobile objects in subsequent steps.
Most techniques based on range measurements either distinguish between static structures and moving objects very crudely or ex-tract moving objects - due to real-time constraints - in a short-term sense which may result in a non-accurate background. The approach presented in this paper uses a technique similar to back-ground subtraction to identify range measurements associated with moving objects. Since the intended field of application does not have real-time constraints, the quantity of all measurements and therefore all available information can be utilized. The ap-proach is also model free, so no assumptions about the environ-ment or the moving objects (aside from the ability to be detectable by a LiDAR sensor) are required. The main contributions are the following:
• We perform a detailed analysis of the inherent capability of
a probabilistic volumetric representation to discard mobile objects.
• The impact of the system parameters onto the background
representation is investigated.
∗Corresponding author
• Based on both insights, a straightforward and yet powerful
approach with unique properties for the labeling of measure-ments as moving objects and static structures is proposed.
This paper is organized as follows: Section 2 provides an overview of related work. The analysis of the probabilistic volumetric rep-resentation and its system parameters is given in Section 3. The process of labeling range measurements based on the volumetric representation is given in Section 4. The proposed approach is evaluated based on the setup described in Section 5. A discussion of the results is given in Section 6. Finally, Section 7 presents our conclusion.
2. RELATED WORK
2.1 Detection of moving objects
The distinction between moving objects and static structures is a relevant topic in many fields of research. Lots of work regard-ing this topic is done in computer vision, especially in relation to Object Trackingin 2D images. Since the focus of this paper is on MLS measurements, the methodically most related topics are Detection and Tracking of Moving Objects (DATMO)andChange Detection. The former is investigated especially in robotics and autonomous driving. The latter one deals with the finding of dif-ferences between several scans of a scene.
Some approaches for change detection such as the one proposed by Girardeau-Montaut et al. (2005) and Zeibak and Filin (2008) compare point clouds of different epochs, but only work under certain conditions such as stationary sensor platforms.
In Hebel et al. (2013), an approach based on the analysis of ev-idential conflicts between free and occupied 3D-space is used to detect changes between two airborne LiDAR scans. Xiao et al. (2015) use a similar approach to detect moving objects in mo-bile LiDAR measurements based on conflict search between a reference and a target epoch. Both approaches require the ob-ject to be completely removed from the space it previously occu-pied and can be misled when one object is replaced by another.
This contribution has been peer-reviewed. The double-blind peer-review was conducted on the basis of the full paper.
Both techniques can in theory be extended to consider all avail-able scans and therefore be avail-able to generate the same results as the approach presented in this work. However, this would lead to quadratic runtime complexity, since each measurement in the dataset must be cross-referenced with vision rays generated from all other measurements.
Azim and Aycard (2012) detect moving objects based on incon-sistencies between scans. An octree-based occupancy grid is uti-lized to represent the current state of the environment. A list of dynamic voxels is managed and updated whenever a conflict between a scan and the environment representation is detected. Since the approach adapts very quickly to changes in the envi-ronment, it is less suitable for the extraction of long-term stable structures. The approach could be modified by tweaking the sen-sor model to consider long-term stable structures, but not without missing most of the moving objects.
InSimultaneous Localization and Mapping (SLAM), the elimi-nation of moving objects can contribute to increase consistency of the environment’s representation. In the approach presented by Litomisky and Bhanu (2013), clusters of point clouds of two different epochs are formed. Correspondences are established between them and based on these, moving objects are detected and removed. A high percentage of the points belonging to static structures is kept, but not all of them. Since that approach is de-signed for SLAM, more emphasis is put on consistency than on a complete representation of the environment.
The approach presented in this work provides an unique combina-tion of properties. First of all, it prevents short-time stable objects from merging with the background; instead it identifies them cor-rectly as moving objects. Most of the fore- and background is kept intact, meaning no larger chunks of measurements are lost. Furthermore, the proposed algorithm has a linear runtime com-plexity. All measurements only need to be touched twice; once to build the volumetric representation and a second time for de-termining their label.
2.2 Volumetric representation
For the representation of the background an occupancy grid has been chosen, since unlike a merely surface-based method the vol-umetric approach is able to describe free and unexplored space. Moravec and Elfes (1985) generate a probabilistic occupancy grid based on data from ultrasonic sensors. It describes the state of the environment along a plane on the sensor level with a proba-bility that indicates either free or occupied space. Although the ultrasonic signal has a conical shape that covers a larger quan-tity of space, the resulting representation is considerably accu-rate. Meagher (1982) presented an approach to model arbitrary geometries that utilizes an octree to store binary occupancy infor-mation. Later the concept has been extended to use probabilistic information (Payeur et al., 1997). Hornung et al. (2013) added a nearly lossless compression strategy based on probability clamp-ing. The latter also allows the fast adaption to a changing en-vironment. This approach has gained huge popularity under the nameOctoMapin the robotic community. Based on this work, we proposed a concept to represent probabilistic volumes on a global scale as well as to handle the efficient storage and retrieval of the associated data (Gehrung et al., 2016).
3. VOLUMETRIC BACKGROUND MODELING
3.1 Approach to volumetric modeling
In the following, the approach for volumetric representation used in this work is briefly outlined. It is based on an approach pro-posed in Gehrung et al. (2016) which is founded on the Bayesian framework established by Hornung et al. (2013). It was favored over a Dempster–Shafer based approach since the combination rule of the latter can lead to non-intuitive results. Also updates require more computational efforts than it is the case for the for-mer one, which requires just a single addition.
For the global management of volumetric environment data, a grid over a global Cartesian reference frame such as ECEF is de-fined. Each grid cell comprises a cubic subspace and is referred to astile. A tile has an unique address and contains a probabilis-tic occupancy octree based on the work of Hornung et al. (2013). This volumetric representation permits the deduction of informa-tion about free, occupied and unexplored space. Each voxel in the octree contains an occupancy probability which corresponds to the logarithm of a fraction that represents a probabilistic two class decision problem. This is also denoted as alog-odd. Due to the transformation into logarithmic space, adjustment of the log-odd can be done by simply adding or subtracting the logarithmic equivalent of a probability.
New range measurements are integrated into the system by ray-casting. For each ray the traversed voxels as well as the end voxel are determined. The log-odd of the corresponding octree nodes are adjusted accordingly; for free spacelfreeis subtracted, occupied space is handled by addinglocc. Both are also referred to as sensor parameters and describe the reliability of the sensor system, more precisely its ability to measure the correct state of the observed space. To ensure fast adaption to changes in the environment, the log-odd is confined to an interval defined by the so-called clamping thresholdslminandlmax. These thresholds are also required for compressing the octree by condensing nodes with a similar state.
3.2 Automatic removal of mobile objects
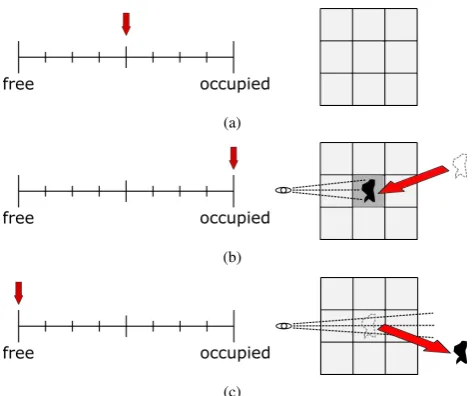
The purpose of this work is to investigate the hypothesis that a volumetric representation constructed as stated above converges to a state where it only contains non-moving objects. This state of the environment is assumed to only contain static structures and non-moving instances of mobile objects. For the sake of simplic-ity both are summarized by the umbrella termbackground. The idea is that a moving object occupies a point along its path only for a short duration. In terms of the volumetric representation this means the following: for all voxels occupied by the object, a probability mass corresponding toloccis added to their occupancy probability. Multiple measurements accumulate probability mass which leads to the occupancy probability converging against the upper clamping threshold, thus implying solidity. Once the ob-ject left the voxels, utilizing a 360 ° rotating laser scanner it is very likely that these are traversed by other range measurements. In such a case the probability mass is reduced bylfree for each ray passing the voxel. This leads to a convergence in direction of the lower clamping threshold. Since the moving object occu-pies a voxel only for a short duration, the amount of measure-ments traversing it outweighs the amount of measuremeasure-ments im-plying solidity. Therefore in the longterm the voxel converges to a free state, removing the former imprint of the moving object. An impression of this process is given in Figure 1.
This contribution has been peer-reviewed. The double-blind peer-review was conducted on the basis of the full paper.
(a)
(b)
(c)
Figure 1. The influence of an object to a voxel’s log-odd based occupancy probability. (a) Voxel with zero knowledge. (b) Voxel
occupied by an object. (c) Voxel after the object left.
3.3 Clamping thresholds and sensor parameters
In this section the impact of both the clamping thresholds and the sensor parameters on the volumetric representation genera-tion process is explained. The clamping thresholdslminandlmax define the lower and upper boundary of an interval that limits the occupancy probability. The interval can either be symmetrical or asymmetrical (cf. Figure 2). The former considers convergence to both the statesfreeandoccupiedas equal. Setting the interval to asymmetric values has the advantage of a faster convergence to either occupied or free, depending on which threshold is closer to the log-odd ofl = 0, which implies equal distribution. Re-gardless of the symmetry aspect it is recommended to select both thresholds in such a way that the behavior of the function is ap-proximately linear.
Figure 2. Symmetric (red) and asymmetric (green) clamping thresholds.
The sensor parameterslfree andlocc can also be selected either in a symmetrical or an asymmetrical way. In the first case the convergence speed towards both states is identical. The latter case leads to faster convergence towards either free or occupied, depending on which sensor parameter is the larger one.
3.4 Minimal observation durations
Based on the parameters described in the last section and the du-ration per scan, the approximate time for a state change can be calculated. If should be noted that due to reasons of consistency, occupancy updates are handled based on scans, not on single
measurements. So the exact number of measurements per voxel does not matter. The period of time required to change a voxel’s state from zero knowledge to occupied is calculated as
tinit=
wheretdpsis the duration per scan in seconds. For a rotating laser scanner this is reciprocal to its rotation frequency. The duration for the transition from zero knowledge to free is defined as
tinit=
The period of time required for a full state change from free to occupied is defined as
whereas the inverse transition from occupied to free is calculated as
Table 1 shows how different clamping thresholds and sensor pa-rameters are able to influence the convergence time between the statesfree,occupiedandzero knowledge. The durations are cal-culated using Equations 1-4. Parameter set A applies symmetri-cal clamping thresholds and sensor parameters. This leads to an unbiased behavior where neither the free nor the occupied state is favored. Parameter set B leads to a faster convergence towards free, both from the initial zero knowledge state as well as the occupied state. This leads to a reset behavior of voxels that con-tained moving objects.
The parameters defined in scenario C result in a fast initial vergence from zero knowledge towards free, whereas the con-vergence times between free and occupied are symmetrical. Pa-rameter set D illustrates the effects of using both asymmetrical clamping thresholds and sensor parameters. The initial conver-gence from zero knowledge towards free is quite fast in contrast to the convergence towards solid. Also the duration between state changes clearly prefers the free state.
A parameter selection such as the one in A may fit most applica-tions. Scenarios may apply asymmetrical parameters like spec-ified in B and C in cases where initial or overall convergence towards one state is preferred. Should both be required, an asym-metrical parameter selection such as in D will be suitable.
Num. lmin lmax lfree locc z→f z→o f→o o→f
A −2 2 −0.04 0.04 5 s 5 s 10 s 10 s
B −2 2 −0.08 0.04 2.5 s 5 s 10 s 5 s
C −0.5 2 −0.04 0.04 1.25 s 5 s 6.25 s 6.25 s
D −0.5 2 −0.08 0.04 0.625 s 5 s 6.25 s 3.125 s
Table 1. Example parameters and the corresponding convergence time for a 10 Hz scan frequency.z,fandodenote
the stateszero knowledge,freeandoccupied.
This contribution has been peer-reviewed. The double-blind peer-review was conducted on the basis of the full paper.
4. MOVING OBJECT SEGMENTATION BY BACKGROUND SUBTRACTION
4.1 Background subtraction
In this section an algorithm for labeling range measurements uti-lizing a volumetric environment representation is proposed. It can also be considered as an experiment designed to evaluate the hy-pothesis presented in Section 3.2. The algorithm’s input consists of a set of range measurements acquired by a mobile LiDAR sen-sor. These are organized asscans, where each scan includes mul-tiple range measurements. A common representation for range measurements are point clouds.
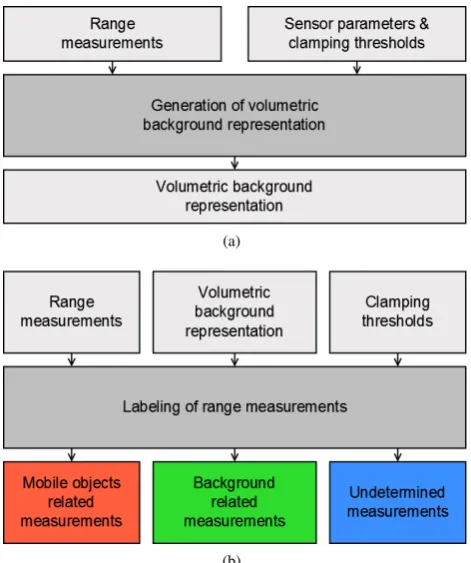
The process consists of two steps that are illustrated in Figure 3 and can be compared to background subtraction as known from computer vision. First, a volumetric representation based on all scans is generated. Based on the assumption explained above this representation should converge to a state where only non-moving instances of mobile objects and static structures are left. In a sec-ond step, the same scans are labeled using the volumetric repre-sentation. For each range measurement the voxel corresponding to its endpoint is determined. Based on the occupancy probability of the voxel in question the following cases can be distinguished:
• If the occupancy probability is larger or equal to an upper
clamping threshold, the measurement belongs to a solid ob-ject.
• If it is less or equal to a lower clamping threshold, the
mea-surement is part of a moving object.
• If none of the preceding cases occurs, the state of the
mea-surement is undetermined.
4.2 Parameter selection
As explained in Section 3.3, the clamping thresholds and sen-sor parameters have a direct impact on the convergence of the volumetric representation and therefore on the labeling results. Therefore it is recommended to utilize the equations presented in Section 3.4 to select the parameters based on whatever dura-tion seems plausible for the case at hand. The octree resoludura-tion has to be adapted to the accuracy and precision of the sensor. If the voxels are too small, minor deviations of the range measure-ments endpoint can lead to inaccuracies of the resulting represen-tation. The size of the voxels will also have influence on the time required to generate the background representation and the dis-cretization errors. Restricting the maximum length of range mea-surements is also worth considering, since in this way negative effects of inaccuracies in geolocalization and sensor calibration can be reduced. Limiting the ray length is a compromise between information loss and the improvement of the background repre-sentation and highly depends on the deployed sensor system. It is recommended to use another set of clamping thresholds for the la-beling step. If both thresholds are closer tol= 0, more points are
labeled either as belonging to a moving object or to background and therefore less points will end up as undetermined.
5. EVALUATION
5.1 Experimental setup
The presented approach has been evaluated with MLS measure-ments taken on the campus of the TU M¨unchen and along public
(a)
(b)
Figure 3. Illustration of the two-stage process for labeling range measurements. (a) Generation of the background representation.
(b) Labeling of range measurements.
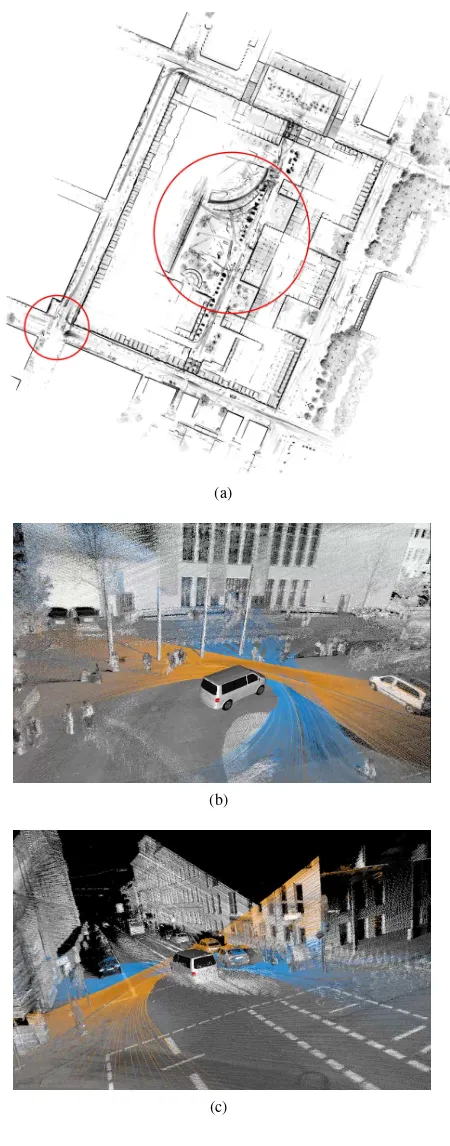
buildings in the vicinity. TheMLS 1 - TUM City Campusdataset consists of georeferenced MLS scans and is publicly available1 under a Creative Commons License. An overview of the dataset is given in Figure 4(a). Measurements have been carried out with the mobile mapping systemMODISSAof Fraunhofer IOSB. The vehicle itself is equipped with four LiDAR sensors. Two Velo-dyne HDL-64E are mounted at an angle of 35 ° on the front roof. This setup makes it possible to cover both a part of the road ahead of the vehicle as well as the facades of the surrounding buildings. Two additional Velodyne VLP-16 Puck are installed on the back of the roof and are inclined by an angle of 15 °. Eight cameras mounted at the roof corners can be utilized to texture the LiDAR measurements. Georeferencing of the measurements is based on navigation data provided by an Applanix POS LV navigation sys-tem with two GNSS antennas, an inertial measuring unit and a distance measuring indicator. The navigation data has been post-processed to increase accuracy.
In this paper, the provided dataset is divided into two subsets that are used to evaluate different facets of the proposed approach. The first subset is referred to asInner Yardand shows a busy inner courtyard on the campus. The sequence has a duration of about 4 minutes and contains multiple groups of people standing or sitting as well as walking around. Also included are several trees with dense foliage whose leaves are moving in the wind. The second subset denoted asCrossingcomprises a traffic sit-uation which the mobile mapping platform waits at a crossing. Multiple cars pass by, passengers and a cyclist cross the road. After 22 seconds the platform continues on its way. Both subsets can be seen in Figure 4(b) and 4(c).
1http://s.fhg.de/mls1
This contribution has been peer-reviewed. The double-blind peer-review was conducted on the basis of the full paper.
(a)
(b)
(c)
Figure 4. The TUM City Campus dataset. (a) Overview. (b) Inner Yard. (c) Crossing.
5.2 Quantitative examination
The results of the approach are examined by comparing its re-sults with a ground truth that comprises per point labels. Since every LiDAR scan consists of about 100000 points, the process of labeling is very time consuming. Therefore an automated ap-proach has been used for ground truth generation. A bounding box has been placed within theCrossingsubset; all points within the box are labeled as belonging to a moving object, all outside
are part of the static environment. This easy approach works quite well, since the scene contains both static and moving objects, but structured in a way that both are easy to divide. This resulting sequence of ground truth data has a duration of 22 seconds.
5.3 Qualitative examination
The quantitative examination is supplemented by a visual inspec-tion by a human observer. The results are examined based on the following criteria:
• Has each moving object at least some measurements labeled
correctly?
• How high is the percentage of correctly labeled
measure-ments per moving object?
• What is the false positive and false negative rate?
• How many percent of all measurements remain
undeter-mined?
These questions are answered based on theInner Yard subset. The labeled results are inspected scan by scan, whereby color coding allows the easy interpretation of the labeled results. In addition to the questions above, the results are inspected for arte-facts and other discrepancies.
5.4 Comparison with other approaches
For a more in-depth evaluation of the proposed approach, it is compared with other techniques for the moving object detection. The goal is to work out the advantages and disadvantages be-tween them. A sliding window approach similar to the one pre-sented by Azim and Aycard (2012) is simulated by building vol-umetric representations for sequences of 10 second length. The corresponding scans are labeled and visually compared to the la-bels created within the scope of theInner Yardsubset.
To compare our work to a per scan based technique, the approach proposed by Zeibak and Filin (2008) has been chosen. This ap-proach compares two depth images created by a stationary Li-DAR sensor. For comparison theCrossingsubset has been se-lected, since at the beginning of the sequence the car is stationary for about 20 seconds.
5.5 Runtime
Since the time required for labeling the range measurements highly depends on the environment and the density of the scans, the runtime regarding this step has been further investigated based on both subsets. More information regarding the generation run-time of the volumetric representation can be found in our other work (Gehrung et al., 2016).
6. RESULTS AND DISCUSSION
6.1 Results of the quantitative examination
For the generation of the volumetric representation the clamp-ing thresholds and sensor parameters were chosen symmetrically and in a way that the convergence time between states is about 8 seconds; this has turned out to be good practice for the given scene and sensor setup. Since the most critical parameter in re-gards to the quality of the results is the octree resolution, the
This contribution has been peer-reviewed. The double-blind peer-review was conducted on the basis of the full paper.
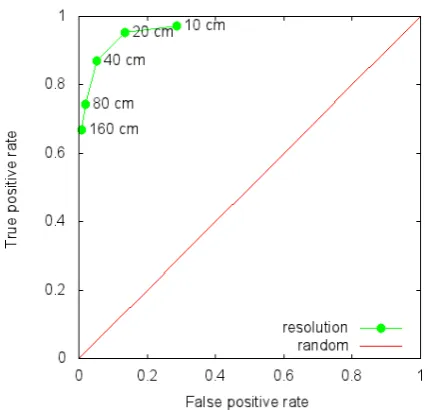
examination has been executed for multiple octree resolutions (caused by selecting multiple depth levels). Table 2 shows the results of quantitative examination - the rates of correct classifi-cation, type I and type II errors. It can be seen that a high reso-lution favors also a high rate of correct classifications, but is also correlated to both type I and type II errors.
Rate 10 cm 20 cm 40 cm 80 cm 160 cm
True Positive Rate 97.2 % 95.2 % 87.1 % 74.3 % 66.9 % True Negative Rate 71.3 % 86.4 % 94.8 % 98.2 % 99.1 % False Positive Rate 28.7 % 13.6 % 5.2 % 1.8 % 0.9 % False Negative Rate 2.8 % 4.8 % 12.9 % 25.7 % 33.1 %
Table 2. The rates of correct classification, type I and type II errors for multiple octree resolutions, calculated based on the
results of the quantitative evaluation.
The corresponding ROC curve in Figure 5 indicates a working point at either a 20 cm or a 40 cm resolution, both with a good trade-off between true positive rate and false positive rate. For the qualitative examination in the next section the latter has been chosen.
Figure 5. ROC curve describing the evaluation results depending on the resolution of the octree.
6.2 Results of the qualitative examination
The parameters for the generation of the volumetric representa-tion were chosen as suggested in the last secrepresenta-tion. The clamp-ing parameters for labelclamp-ing have been set tolmin = −0.5and
lmax = 0.5to decrease the number of points labeled as
unde-termined. An impression of the labeled results can be found in Figure 6.
Coverage of all moving objects– All moving objects were man-ually identified by comparing multiple scans in chronological or-der. In summary, it can be stated that surface points have been de-tected on all moving objects. Several times it has been observed that persons that stopped for a few seconds were still labeled as a moving object. This can be considered as a clear benefit in comparison to the sliding window approach.
Coverage per moving object– All moving objects were closely examined by a human observer. The number of correctly labeled
Figure 6. A labeled scan from theInner Yardsubset. The point clouds are divided into the categoriesmoving object(red),static
structure(green) andundetermined(blue).
(a) (b) (c)
Figure 7. Examples for moving objects and vegetation. Moving object (red), static structure (green) and undetermined (blue). (a)
Discretization error. (b) Labeling error due to partial movement. (c) Tree with leaf movement.
measurements corresponds the the rates determined by the quan-titative examination. The rest is usually considered to be static and is located within the lower part of the object. The reason for this are discretization errors caused by overlaps of the object with volumes containing the ground. In other, less frequently observed cases larger block-shaped parts were labeled incorrectly as being uncertain or solid. This happens usually when a person stands still for most of the time and only moves occasionally. See also Figure 7(a) – 7(c).
False positive and false negative rate– False negatives are mea-surements of moving objects that are labeled incorrectly to be part of a static object or structure. This was mostly observed in the case of discretization errors and partly moving objects as dis-cussed above.
False positives include all measurements of static structures and objects that are incorrectly labeled as belonging to a moving ob-ject. These appear in multiple cases. Both grid-like structures and leafs are sometimes hit by a laser, sometimes not (see Figure 7(c)). This leads to conflicting measurements which cause the corresponding voxels to converge towards the state of being free. This in turn marks all measurements ending within the voxel as being part of a moving object. False positives can also happen be-cause of sensor noise. The latter leads to incorrect labeled points that are distributed in a non-systematic way along the surfaces of static background. That effect appears to become stronger the smaller the voxels are.
Multiple times in both subsets huge spots of false positives were observed, mostly on the ground or on walls (compare Figure 8). Their size varies between half a meter and multiple meters. Due to the clustering of affected voxels in close proximity to each other a systematic cause for this artefact is assumed. A possible explanation is that this effect is generated by measurement rays
This contribution has been peer-reviewed. The double-blind peer-review was conducted on the basis of the full paper.
Figure 8. Solid ground (green) labeled as undetermined (blue) or moving (red), possibly due to measurements under unfavorable
incidence angle.
that pass along the said plane in a relatively flat angle, thereby traversing voxels belonging to the plane (cf. Figure 9). As a consequence, the state of these voxels is changed step by step until they are considered to be free. A possible explanation for the different degrees of belief - visible in form of different labels in Figure 8 - could be measurement noise or sensor calibration errors.
Figure 9. A ray may traverse other voxels assumed to be solid before hitting a surface, thereby successively changing their
state to free.
Rate of undetermined measurements– One of the two states can only be assigned to a measurement once its occupancy prob-ability is beyond the corresponding clamping threshold. As de-scribed above these have been adapted to reduce the number of undetermined measurements. The result of this action is that only 5 % of all measurements cannot be labeled as either being static or part of a moving object.
6.3 Differences to other approaches
Sliding window– The labeling results of the sliding window based approach are comparable with the ones described in Sec-tion 6.2. Also present is the false positive artefact, which has the same characteristics. Since the window has a length of only 10 seconds, surface points of slowly moving or deforming ob-jects like flags are associated mostly with incorrect static labels. It appears also to be less likely to label measurement points on a person that has stopped for a few seconds correctly, especially if the action of stopping extends over several windows. The results show that a sliding window based approach has only a subset of the capability of an approach that considers all available measure-ments.
Scan based comparison– In case of a stationary sensor with a high scan rate, the successive scan based approach tends to gen-erate false negatives. This is due to the fact that the difference in
the 2.5D depth image is too small to be considered as a move-ment of the corresponding object. In theory this could be handled by carefully adapting the threshold, in practice the sensor noise limits these efforts to some lower boundary. This is an inherent problem of an approach that is based on the comparison of suc-cessive scans; one that the approach presented in this paper does not have.
Another difference between both approaches is the ability to han-dle sensor movement. Depending on the parametrization of the scan comparison based approach there are either lots of false pos-itives or lots of false negatives, since it only works based on 2.5D information. The approach proposed in this work utilizes geolo-cated full 3D measurements and is therefore able to handle also a moving platform, although the associated noise due to localiza-tion errors effect the results in a negative way.
6.4 Runtime
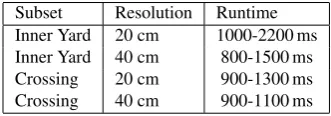
Subset Resolution Runtime Inner Yard 20 cm 1000-2200 ms Inner Yard 40 cm 800-1500 ms Crossing 20 cm 900-1300 ms Crossing 40 cm 900-1100 ms
Table 3. The runtime for theInner YardandCrossingsubset, determined with different voxel resolutions.
The runtime for the labeling process has been determined for both subsets and with different voxel sizes. The results can be seen in Table 3. Since not all scans contain the same number of measure-ments, the runtimes are stated as an interval. It can be assumed that the upper runtime boundary is also affected by reloading op-erations of volumetric data from the hard drive if the former one has not been found in the in-memory cache. The results show that while the labeling is executed quite fast it would not be able to process the measurements from a Velodyne LiDAR sensor in realtime, since this would require a runtime of less that 100 ms.
7. CONCLUSION AND FUTURE WORK
We have presented a straightforward, yet powerful approach to distinguish measurements of a mobile LiDAR sensor into mov-ing objects and static background. It relies on the hypothesis that a probabilistic volumetric representation converges against a point where it is free of moving objects and therefore can be used for background subtraction. An evaluation of the approach consisting of both a quantitative and a qualitative part based on a real-world dataset proved the hypothesis, but also showed spe-cial cases such as vegetation that need to be handled separately. For most moving objects 87-95 % of all measurements are la-beled correctly; all moving objects were provided with labels. The amount of measurements which can not be associated with either background or moving objects is less than 5 %. It has been shown that even moving objects stopping for some time are still labeled correctly, since the full time horizon available is consid-ered.
In the future, we plan to further investigate solutions for the arte-fact that causes larger spots of static background to be labeled as moving object. It is also planned to apply the approach for point cloud labeling within the context of change detection.
This contribution has been peer-reviewed. The double-blind peer-review was conducted on the basis of the full paper.
References
Azim, A. and Aycard, O., 2012. Detection, classification and tracking of moving objects in a 3d environment. In: Proceed-ings of the IEEE Intelligent Vehicles Symposium (IV), pp. 802– 807.
Gehrung, J., Hebel, M., Arens, M. and Stilla, U., 2016. A frame-work for voxel-based global scale modeling of urban environ-ments. In: ISPRS - International Archives of the Photogram-metry, Remote Sensing and Spatial Information Sciences, Vol. XLII-2/W1, pp. 45–51.
Girardeau-Montaut, D., Roux, M., Marc, R. and Thibault, G., 2005. Change detection on point cloud data acquired with a ground laser scanner. In:International Archives of Photogram-metry, Remote Sensing and Spatial Information Sciences, Vol. 36-3/W19, pp. 30–35.
Hebel, M., Arens, M. and Stilla, U., 2013. Change detection in ur-ban areas by object-based analysis and on-the-fly comparison of multi-view ALS data. ISPRS Journal of Photogrammetry and Remote Sensing86, pp. 52–64.
Hornung, A., Wurm, K. M., Bennewitz, M., Stachniss, C. and Burgard, W., 2013. Octomap: An efficient probabilistic 3d mapping framework based on octrees. Autonomous Robots 34(3), pp. 189–206.
Litomisky, K. and Bhanu, B., 2013. Removing Moving Objects from Point Cloud Scenes. Vol. 7854, Springer Berlin Heidel-berg, Berlin, HeidelHeidel-berg, pp. 50–58.
Meagher, D., 1982. Geometric modeling using octree encoding. Computer Graphics and Image Processing19(2), pp. 129–147.
Moravec, H. and Elfes, A., 1985. High resolution maps from wide angle sonar. In: Proceedings of the 1985 IEEE Interna-tional Conference on Robotics and Automation, pp. 116 – 121.
Payeur, P., Hebert, P., Laurendeau, D. and Gosselin, C. M., 1997. Probabilistic octree modeling of a 3d dynamic environ-ment. In:Proceedings of the IEEE International Conference on Robotics and Automation, Vol. 2, pp. 1289–1296.
Xiao, W., Vallet, B., Br´edif, M. and Paparoditis, N., 2015. Street environment change detection from mobile laser scan-ning point clouds.ISPRS Journal of Photogrammetry and Re-mote Sensing38, pp. 38–49.
Zeibak, R. and Filin, S., 2008. Change detection via terrestrial laser scanning. In: International Archives of Photogramme-try, Remote Sensing and Spatial Information Sciences, Vol. 36, pp. 430–435.
This contribution has been peer-reviewed. The double-blind peer-review was conducted on the basis of the full paper.