EVALUATING THREE INSAR TIME-SERIES METHODS TO ASSESS CREEP MOTION,
CASE STUDY: MASOULEH LANDSLIDE IN NORTH IRAN
S. Mirzaee a, *, M. Motagh b, c, B. Akbari a, H.U. Wetzel b, & S. Roessner b
a Forest, Range and Watershed Management Organizations of Iran
b GFZ German Research Centre for Geosciences, Department of Geodesy, Section of Remote Sensing, Potsdam,
Germany
c Institute for Photogrammetry and GeoInformation, Leibniz University Hannover, 30167 Hannover, Germany
Commission III, WG III/3
KEY WORDS: Landslide, InSAR method, SqueeSAR, PSI, SBAS
ABSTRACT:
Masouleh is one of the ancient cities located in a high mountainous area in Gilan province of northern Iran. The region is threatened by a hazardous landslide, which was last activated in 1998, causing 32 dead and 45 injured. Significant temporal decorrelation caused by dense vegetation coverage within the landslide area makes the use of Synthetic Aperture Radar Interferometry (InSAR) for monitoring landslide movement very challenging. In this paper, we investigate the capability of three InSAR time-series techniques for evaluating creep motion on Masouleh landslide. The techniques are Persistent Scatterer Interferometry (PSI), Small BAseline Subset (SBAS) and SqueeSAR. The analysis is done using a dataset of 33 TerraSAR-X images in SpotLight (SL) mode covering a period of 15 months between June 2015 and September 2016. Results show the distinguished capability of SqueeSAR method in comparison to 2 other techniques for assessing landslide movement. The final number of scatterers in the landslide body detected by PSI and SBAS are about 70 and 120 respectively while this increases to about 345 in SqueeSAR. The coherence of interferograms improved by about 37% for SqueeSAR as compared to SBAS. The same rate of displacement was observed in those regions where all the methods were able to detect scatterers. Maximum rates of displacement detected by SqueeSAR technique in the northern edge, older and younger part of the landslide body are about -39, -65 and -22 mm/y, respectively.
* Corresponding author
1. INTRODUCTION
Landslide is one of the forms of erosion processes which mainly occurs in steep slopes due to various triggering factors (Cruden and Varnes, 1996; Hungr et al., 2001). The mass wasting that occurs in landslide regions threatens many lives and properties. Therefore, early monitoring and detection of active movement of landslide is of great interest for governments and decision makers (Wang et al., 2013).
The rapid development of space technology over the last 3 decades has allowed us to use the microwave remote sensing technique of Synthetic Aperture Radar Interferometry (InSAR) as an efficient and powerful geodetic method for measuring surface motion over wide areas (thousands of kilometres). Artifacts arising from atmospheric noise and temporal and spatial baseline decorrelations are a limiting factor for assessing slow and transient creep motion in landslide regions (Akbarimehr et al., 2013; Haghshenas Haghighi and Motagh, 2016; Motagh et al., 2013; Tong and Schmidt, 2016; Wasowski and Bovenga, 2014). Recent developments in Multi Temporal InSAR (MTI) algorithms and sensor technology has enhanced our capability to monitor slow moving landslides with millimetric precision (Colesanti et al., 2003; Ferretti et al., 2001; Werner et al., 2003). Permanent/Persistent Scatterer Interferometry (PSI) (Ferretti et al., 2000; Hooper et al., 2004; Werner et al., 2003; Crosetto et al., 2016) and Small BAseline Subset (SBAS) (Berardino et al., 2002; Lanari et al., 2004) techniques identify coherent targets with phase stability over a specific observation period. Both techniques have been
implemented in StaMPS software (Hooper and Zebker, 2007; Hooper, 2008). PSI technique is based on single master interferograms and uses an approach based either amplitude (Ferretti et al., 2001, 2000) and/or phase criterion (Hooper et al., 2004) for permanent/persistent scatterer (PS) selection, but it does not work efficiently for natural targets and/or when coherence is low due to temporal and spatial decorrelations, leading to low PS density. SBAS technique is based on multiple-master interferograms and works with interferograms with small spatial baselines and short temporal baselines to overcome decorrelations and increase temporal and spatial sampling. This method was first based on a coherence criterion (Berardino et al., 2002; Usai, 2003) and then improved by using phase characteristics for PS selection which is suitable in areas covered with natural targets (Hooper and Zebker, 2007; Hooper, 2008).
Both PSI and SBAS techniques work best in urban areas because of the high density of man-made objects, which increase the likelihood of finding coherent pixels in a stack of SAR data over time. Natural targets, which are the case for landslide and are usually located in non-urban areas, characterized by scarce vegetation, show typically low coherence values (Ferretti et al., 2011; Lu et al., 2012; Tofani et al., 2013, Motagh et al., 2017). These areas are known as distributed targets and are more efficiently assessed through SqueeSAR technique (Ferretti et al., 2011). SqueeSAR technique improves the density of selected targets for interferometric processing and increases the interferometric ISPRS Annals of the Photogrammetry, Remote Sensing and Spatial Information Sciences, Volume IV-1/W1, 2017
ISPRS Hannover Workshop: HRIGI 17 – CMRT 17 – ISA 17 – EuroCOW 17, 6–9 June 2017, Hannover, Germany
This contribution has been peer-reviewed. The double-blind peer-review was conducted on the basis of the full paper.
coherence based on statistical approaches (Ferretti et al., 2011). On the other hand, the advancements in the new generation of X-band sensors such as TerraSAR-X and CosmoSkyMed with high spatiotemporal resolutions, has enabled us to assess the small deformation features in landslide areas in great details (Notti et al., 2010; Motagh et al., 2013). In this paper, we study
the capability of the three processing algorithms including PSI, SBAS and SqueeSAR to evaluate landslide movements in Masouleh, located in Gilan province of northern Iran. To this end, we use 33 TerraSAR-X images in SpotLight (SL) mode spanning June 2015 to September 2016.
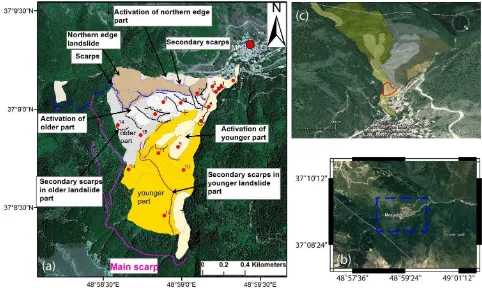
Figure 1. (a) Masouleh landslide; geological scarps and moving body are overlayed on the SPOT image acquired on 8 February 2015. Three main regimes of the landslide are depicted with yellow, gray and brown polygons showing the younger part, older part
and northern edge of the landslide respectively. The red circle shows Masouleh city. (b) Google Earth image of the Masouleh city with the blue dashed rectangle showing cropped area of SAR image that is used in the processing. (c) Three dimensional view of the
moving slope. The red polygon illustrates the most active slope on the lower part of the younger landslide.
2. STUDY AREA AND DATASAT
Masouleh is an ancient and tourist city in Gilan province of northern Iran, 60 kilometres west of the Rasht, Capital city of Gilan province. The city lies in the crossing of two rivers named Khalildasht and Doulichal, which are merged to the Masouleh Roudkhan River at the entrance of the city. 40 percent of the whole Khalildasht sub-basin consists of unstable areas and therefore mass movement appears in different forms of fall, slip and flow. Geological units of Masouleh Roudkhan watershed basin consist of Palaeozoic metamorphic rocks and sedimentary rocks of Jurassic and Cretaceous (Mesozoic). The basement of the city is located on the phyllite and slate rocks. Except for the elevated part of the city, which is mainly damaged pasture, other areas are covered by Forest and pasture. Figure 1(a) shows the landslide body with the main and secondary scarps illustrated with different colours. Masouleh landslide has three main sections named as (based on distribution of scarps and structural discontinuity): younger part (yellow polygon in Figure 1(a)), older part (gray polygon in Figure 1(a)) and northern edge segment (brown polygon in Figure 1(a)). The
most recent survey and field observations show that the most active part of the landslide is situated in the lower part of the slope, depicted with a red polygon in Figure 1(c).
We analyzed 33 synthetic aperture radar (SAR) data from German TerraSAR-X mission in SpotLight imaging mode from June 2015 to September 2016. The data was acquired in an ascending geometry with a scene centre incidence angle of 22°. SpotLight imaging mode of synthetic aperture radar data is obtained through azimuth steering angle extension which leads to an enhancement in geometric resolution (Werninghaus and Buckreuss, 2010). This enhancement provides the ability of smaller scatterer detection that is highly advantageous for assessing deformation in small areas such as landslide regions and engineering infrastructures (Iglesias et al., 2012; Mittermayer et al., 2014; Emadali et al., 2017). In addition, a pair of TanDEM-X bistatic images in StripMap imaging mode with a scene centre incidence angle of 41° and spatial baseline of about 103m was used to generate an external digital elevation model for InSAR time-series analysis.
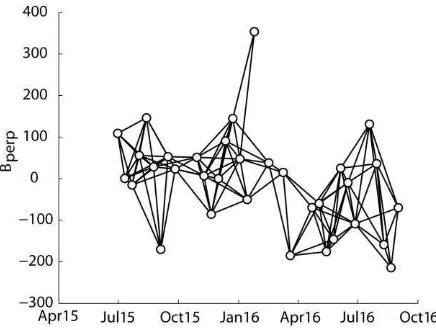
Figure 2. Baseline-time plot of the TerraSAR-X data in ascending geometry
3. DATA PROCESSING AND METHODS
We used 32 single master interferograms for PSI analysis and generated 121 interferograms for SBAS technique. All interferometric processing was implemented using DORIS software (Kampes et al., 2004) with topographic phase being removed using a TanDEM-X DEM generated from a pair of bistatic images acquired on 31st of August, 2014. Both PSI and SBAS processing were then implemented using the StaMPS method (Hooper and Zebker, 2007; Hooper, 2008).
All interferograms in PSI method were referenced to the image acquired on 1st of December, 2016, while for the SBAS all interferograms with perpendicular and temporal values less than 500 m and 100 days, respectively were generated. Figure 2 shows the baseline-time plot of the SBAS dataset.
For the SqueeSAR method we developed our own program based on Ferretti et al. (2011) paper. This method is based on 3 steps. In the first step, siblings with the same statistics known as statistically homogeneous pixels (SHP) are detected for each image pixel in a predefined window size. The window size was selected as 15 15 in our work that is approximately 225 m2. Pixels with less than 20 SHPs were excluded from the processing in order to preserve persistent scatterers (Ferretti et al., 2011). The remaining pixels are named as distributed scatterers (DS). In the second step, phase optimization is applied to each DS using its SHPs and based on BFGS (Broyden–Fletcher–Goldfarb–Shanno) nonlinear optimization algorithm (Fletcher, 1987). Finally a coherence index is computed for each DS with the optimized phase values and pixels with coherence greater than 0.2 are selected as final DS targets. More information on the algorithm can be found on Ferretti et al., (2011). Our program works on the cropped and resampled single look complex (SLC) images and replaces the old phase values with the optimized ones. We then implemented SBAS analysis on the interferograms generated using the new images with optimized phase values.
The velocity obtained through InSAR time series analysis is in the Line-Of-Sight (LOS) direction from satellite to the ground. In order to have a better insight into the mass movement behaviour, displacement values were projected on to the slope direction using the following equations (Cascini et al., 2010; Schlögel et al., 2015).
/ ( . )
slope los los slope
D D n n (1)
WhereDlosandDslopeindicate the LOS and slope displacements
respectively, nlosis the LOS unit vector and nslope is the slope
unit vector. The nlos and nslope are derived based on the
following equations:
( sin cos , sin sin , cos )
los s s
n (2)
( sin cos , cos cos , sin ) slope
n (3)
Where is the incidence angle with respect to the flat earth,
s
is the angle between azimuth and north direction, is the slope angle and is the aspect angle, slope.
20150630 – 20150802, Bp = 53 m
Figure 3. (a) and (b) Coherence generated with SBAS and SqueeSAR methods respectively. (c) and (d) The corresponding
interferograms of (a) and (b), respectively.
4. RESULTS AND DISCUSSION
4.1 Interferometric coherence comparison
Figure 3 illustrates the improvement in the quality of interferograms generated using SBAS and SqueeSAR method. Figure 3(a) and (b) correspond to the coherence obtained with SBAS and SqueeSAR respectively while (c) and (d) show the interferograms obtained with these methods. The interferograms in Figure 3(a) and (b) have temporal and spatial baseline of 33 days and 53m respectively. For this exemplary interferogram, the average coherence of the cropped image obtained with SBAS is about 0.37 while it is about 0.57 for SqueeSAR. The number of pixels with coherence values greater than 0.5 is about 45787 for SBAS, while this number increases to 114762 for SqueeSAR method (an improvement of about 37%). ISPRS Annals of the Photogrammetry, Remote Sensing and Spatial Information Sciences, Volume IV-1/W1, 2017 ISPRS Hannover Workshop: HRIGI 17 – CMRT 17 – ISA 17 – EuroCOW 17, 6–9 June 2017, Hannover, Germany
This contribution has been peer-reviewed. The double-blind peer-review was conducted on the basis of the full paper.
4.2 Average velocity maps
Figure 4 shows the slope displacement map corresponding to the three processing methods mentioned above. As expected, SqueeSAR method has detected more jointly permanent and distributed scatterers (3600) for the whole area as compared to permanent scatterers detected by PSI (770) and SBAS (1560).
Figure 4. Displacement map in slope direction for (a) PSI, (b) SBAS and (c) SqueeSAR methods. The solid line AA’ in Figure
4(a) shows the profile used for comparsion between 3 methods in Figure 6. The vectors H and L represent the satellite heading
and look direction, respectively. Point B in Figure 4(b) is selected for time series analysis that is plotted in Figure 5.
The number of scatterers detected in each of the three landslide regions is shown in Table 1. The total number of scatterers detected in the landslide body improved from 70 and 120 for
PSI and SBAS methods respectively to 345 for SqueeSAR method. Therefore, the density of scatterers and detectability of the activation zones has greatly improved with SqueeSAR, which is particularly evident in the older part of the landslide. Maximum rate of slope displacement detected by SqueeSAR in the younger part of the landslide is about -22 mm/y, while it is about -65 and -39 mm/y in the older and northern edge of the landslide respectively.
PSI has only detected a few pixels in the upper part of the slope in this region (gray polygon in Figure 1 and Figure 4) and as a result cannot identify any activity in this region. SBAS has performed better than PSI and has retrieved some information both on the upper part of the old segment and the middle part of the slope, on the boundary between younger and northern edge segment.
Yp Op Ne Total
PSI 38 27 9 74
SBAS 43 54 24 121
SqueeSAR 71 180 94 345
Table 1: Number of scatterers detected by PSI, SBAS and SqueeSAR techniques in the landslide body. Yp, Op and Ne
refer to younger part, older part and northern edge of the landslide, respectively.
The terrace area depicted with a red polygon in Figure 1(c) and Figure 3 at the lowest part of the slope in the younger region of the landslide, is the most active part of the slides based on field observations. We had 3 campaigns of GPS observations on the slope (results not shown here) that show downslope movements by as much as about 72 cm/y in this region. Radar observations from TerraSAR-X is seriously affected by decorrelation caused by aliasing due to big movement in this area and as a result none of the methods were able to select persistent or distributed scatterers.
Figure 5. Slope displacement time series for point B shown in Figure 4(b). Black, red and blue triangles correspond to PS,
SBAS and SqueeSAR methods respectively.
It is worth noting that the same rate of displacement was observed in those regions where all the methods were able to detect scatterers. Displacement velocity for an exemplary point B (shown in Figure 4(b)) selected in upper part of the older landslide region, where all methods detected enough scatterers, is investigated to show the consistency of different results in coherent regions. Displacement value is obtained through averaging in an area with 16m diameter. Time series of slope motion for point B is plotted in Figure 5. All three methods detected slope displacement velocity of about -19 mm/y. ISPRS Annals of the Photogrammetry, Remote Sensing and Spatial Information Sciences, Volume IV-1/W1, 2017
Maximum displacement of point B in PS, SBAS and SqueeSAR methods was about -24.9, -24.8 and -24.6 mm respectively.
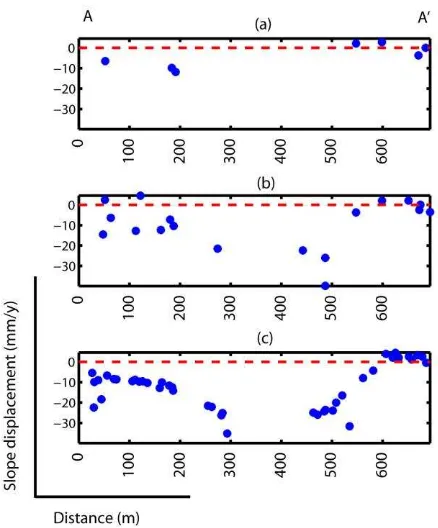
To better evaluate the landslide behaviour we extracted slope motion along a profile which starts from the upper parts of the older landslide and continues to the activated zone of the northern edge part of landslide. The solid black line in Figure 4(a) shows the footprint of the profile (AA’). Mean slope displacement plotted for the three investigated methods is shown in Figure 6. The profile AA' and the velocity map in Figure 4, show how the increased number of detected targets in SqueeSAR, can help us better interpret the complex kinematics of the landslide. We observe that the upper zone of the slide in older part is active and is moving at an average rate of -14 mm/y (average of all pixels in that region along AA'). The motion, however, is not uniform and starts from approx. -5 mm/y in the start of the profile to a maximum of -35 mm/y at 293 m from point A. Another active zone that is situated between 463 and 580 m from point A, illustrates the northern edge part of the landslide, which is moving at an average rate of -20 mm/y. The rest of the profile from 600m to the end shows the urban area with an average rate of displacement values about zero.
Figure 6. Mean slope displacement plotted for profile AA' in Figure 4(a). (a), (b) and (c) show the profiles resulted from PSI,
SBAS and SqueeSAR methods respectively. over the efficiency of these techniques showed that, in our case study which is located in a non-urban environment, SqueeSAR was more efficient for evaluating landslide kinematics. The number of scatterers detected by SqueeSAR improved by about 3.7 times in comparison to PSI and by about 2 times in comparison to SBAS in the landslide region. Natural distributed targets show lower temporal coherence due to spatial
and/or temporal decorrelations which do not exceed the threshold for PS selection. This results in few numbers of permanent scatterers that cannot capture the pattern of landslide motion reliably. SqueeSAR makes change to phase values over distributed targets and improves the coherence. Therefore we observe a meaningful increase in the density of selected targets and therefore a better evaluation of the complex behaviour of the landslide.
Our results show that Masouleh landslide is active and creeping. The rate of creeping, however, is not uniform. In the older part of the landslide, the upper zone moves at an average rate of -11 mm/y while the lower zone moves at an average rate of -26 mm/y. The northern edge of the landslide also moves at an average rate of -20 mm/y. However, none of InSAR methods were able to detect any reliable pixels for assessing the movement of younger part and in particular the most active area in the terrace region due to loss of coherence. As a result, the combination of the ground-based geodetic techniques such as GPS measurements and InSAR time series analysis can complement each other and help us benefit from advantages of each method for monitoring applications.
Moreover, InSAR time series results can only detect the displacement in a single direction, which is line-of-sight from satellite to the ground. In this regard, future works will focus on the comparison between the results obtained through InSAR time series analysis and GPS observations to investigate 3 dimensional movement pattern of the landslide.
ACKNOWLEDGMENT
We thank Dr. Mohsen Yousefpour, Ali Jamali, Mohammad Bagher Rafati, Akbar Mohtadi and Davoud Fard for helping with field observations. TerraSAR-X original data is copyright German Aerospace Center (DLR) and provided under proposal motagh_GEO1916.
REFERENCES
Akbarimehr, M., Motagh, M., Haghshenas, M., 2013. Slope Stability Assessment of the Sarcheshmeh Landslide, Northeast Iran, Investigated Using InSAR and GPS Observations. Remote Sens. 5, 3681–3700.
Berardino, P., Fornaro, G., Lanari, R., Sansosti, E., 2002. A new algorithm for surface deformation monitoring based on small baseline differential SAR interferograms. IEEE Trans. Geosci. Remote Sens. 40, 2375–2383.
Cascini, L., Fornaro, G., Peduto, D., 2010. Advanced low- and full-resolution DInSAR map generation for slow-moving landslide analysis at different scales. Eng. Geol. 112, 29–42.
Colesanti, C., Ferretti, A., Prati, C., Rocca, F., 2003. Monitoring landslides and tectonic motions with the Permanent Scatterers Technique. Eng. Geol. 68, 3–14.
Crosetto, M., Monserrat, O., Cuevas-González, M., Devanthéry, N., Crippa, B., 2016. Persistent Scatterer Interferometry: A review. ISPRS J. Photogramm. Remote Sens. 115, 78–89.
Cruden, D.M., Varnes, D.J., 1996. Landslide types and processes. Turn. AK, Schuster, RL Landslides Investig. mitigation, Spec. Rep. 247.
ISPRS Annals of the Photogrammetry, Remote Sensing and Spatial Information Sciences, Volume IV-1/W1, 2017 ISPRS Hannover Workshop: HRIGI 17 – CMRT 17 – ISA 17 – EuroCOW 17, 6–9 June 2017, Hannover, Germany
This contribution has been peer-reviewed. The double-blind peer-review was conducted on the basis of the full paper.
Ferretti, A., Fumagalli, A., Novali, F., Prati, C., Rocca, F., Rucci, A., 2011. A New Algorithm for Processing Interferometric Data-Stacks: SqueeSAR. IEEE Trans. Geosci. Remote Sens. 49, 3460–3470.
Ferretti, A., Prati, C., Rocca, F., 2001. Permanent scatterers in SAR interferometry. IEEE Trans. Geosci. Remote Sens. 39, 8– 20.
Ferretti, A., Prati, C., Rocca, F., 2000. Nonlinear subsidence rate estimation using permanent scatterers in differential SAR interferometry. IEEE Trans. Geosci. Remote Sens. 38, 2202– 2212.
Fletcher, R., 1987. Practical Methods of Optimization, John and Sons Chichester.
Haghshenas Haghighi, M., Motagh, M., 2016. Assessment of ground surface displacement in Taihape landslide, New Zealand, with C- and X-band SAR interferometry. New Zeal. J. Geol. Geophys. 59, 136–146.
Hooper, A., Zebker, H.A., 2007. Phase unwrapping in three dimensions with application to InSAR time series. J. Opt. Soc. Am. 24, 2737–2747.
Hooper, A., Zebker, H., Segall, P., Kampes, B., 2004. A new method for measuring deformation on volcanoes and other natural terrains using InSAR persistent scatterers. Geophys. Res. Lett. 31, 1–5.
Hooper, A.J., 2008. A multi-temporal InSAR method incorporating both persistent scatterer and small baseline approaches. Geophys. Res. Lett. 35.
Hungr, O., Evans, S.G., Bovis, M.J., Hutchinson, J.N., 2001. A review of the classification of landslides of the flow type. Environ. Eng. Geosci. 7, 221–238.
Iglesias, R., Monells, D., Centolanza, G., Mallorqui, J.J., Fabregas, X., Aguasca, A., 2012. Landslide monitoring with spotlight TerraSAR-X DATA, in: 2012 IEEE International Geoscience and Remote Sensing Symposium. IEEE, pp. 1298– 1301.
Kampes, B.M., Hanssen, R.F., Perski, Z., 2004. Radar interferometry with public domain tools, in: European Space Agency, (Special Publication) ESA SP. pp. 59–68.
Lanari, R., Mora, O., Manunta, M., Mallorquí, J.J., Berardino, P., Sansosti, E., 2004. A small-baseline approach for investigating deformations on full-resolution differential SAR interferograms. IEEE Trans. Geosci. Remote Sens. 42, 1377– 1386.
Lu, P., Casagli, N., Catani, F., Tofani, V., 2012. Persistent Scatterers Interferometry Hotspot and Cluster Analysis (PSI-HCA) for detection of extremely slow-moving landslides. Int. J. Remote Sens. 33, 466–489.
Mittermayer, J., Wollstadt, S., Prats-Iraola, P., Scheiber, R., 2014. The terraSAR-X staring spotlight mode concept. IEEE Trans. Geosci. Remote Sens. 52, 3695–3706.
Motagh, M., Wetzel, H.-U., Roessner, S., Kaufmann, H., 2013. A TerraSAR-X InSAR study of landslides in southern Kyrgyzstan, Central Asia. Remote Sens. Lett. 4, 657–666.
Notti, D., Davalillo, J.C., Herrera, G., Mora, O., 2010. Assessment of the performance of X-band satellite radar data for landslide mapping and monitoring: Upper Tena Valley case study. Nat. Hazards Earth Syst. Sci. 10, 1865–1875.
Schlögel, R., Doubre, C., Malet, J., Masson, F., 2015. Landslide deformation monitoring with ALOS/PALSAR imagery: A D-InSAR geomorphological interpretation method. Geomorphology 231, 314–330.
Tofani, V., Raspini, F., Catani, F., Casagli, N., 2013. Persistent Scatterer Interferometry (PSI) Technique for Landslide Characterization and Monitoring. Remote Sens. 5, 1045–1065.
Tong, X., Schmidt, D., 2016. Active movement of the Cascade landslide complex in Washington from a coherence-based InSAR time series method. Remote Sens. Environ. 186, 405– 415.
Usai, S., 2003. A least squares database approach for SAR interferometric data. IEEE Trans. Geosci. Remote Sens. 41, 753–760.
Wang, G., Xie, M., Chai, X., Wang, L., Dong, C., 2013. D-InSAR-based landslide location and monitoring at Wudongde Hydropower Reservoir in China. Environ. Earth Sci. 69, 2763– 2777.
Wasowski, J., Bovenga, F., 2014. Investigating landslides and unstable slopes with satellite Multi Temporal Interferometry: Current issues and future perspectives. Eng. Geol.
Werner, C., Wegmuller, U., Strozzi, T., Wiesmann, A., 2003. Interferometric point target analysis for deformation mapping. IGARSS 2003. 2003 IEEE Int. Geosci. Remote Sens. Symp. Proc. (IEEE Cat. No.03CH37477) 7, 4362–4364.
Werninghaus, R., Buckreuss, S., 2010. The TerraSAR-X mission and system design. IEEE Trans. Geosci. Remote Sens. 48, 606–614.