INTEGRATION OF REMOTE SENSING AND GIS IN GROUND WATER QUALITY ASSESSMENT AND MANAGEMENT
Nadia Babiker Ibrahim.Shakak
Minisrty of Water Resources, Ground Water Resource General Directorate PhD Student, Oumdorma University, UNESCO Chair for Water Resource Science, Sudan Authority for Remote Sensing Centre and Geographical
information System, Nile Street, Khartoum, Sudan .Email:[email protected]
“KEY WORDS”: Ground Water Quality, Potable Drinkable, Irrigation, Parameters, Spatial interpolation.Satellite image,
ABSTRACT:
Introduction:
The quality of water is a vital concern for mankind since it is directly linked with human welfare.The ground water has been considered as drinking and irrigation purposes in most part ofour country. It is estimated that 80 percent of domestic needs in rural areas and 50 percent of domestic needs in urban areas were met by ground water supply.The overdependence on groundwater to meet ever-increasing demands of domestic, agriculture, and industry sectors has resulted in over exploitation of groundwater resources in several states, in Khartoum state is developed to the maximum extent for irrigation by means of wells and almost all the irrigation wells are fitted with centrifugal pumps energised by electric power. Groundwater can be optimally used and sustained only when the quantity and quality is properly assessed. It was observed that in some locations particulary southern part of Khartoum and east of the Nile, the groundwater has been influenced by the waste water disposal in microbial content.and chemical pollution, and uncontrolled industrial disposal contributed in raising the concentration of some patametres (NBCBN, Sudan Node, UNESCO-Chair, 2010). GIS is utilized to locate groundwater quality zones suitable for different usages such as irrigation and domestic use. In this study GIS was used to prepare layers of maps to locate promising well sites based on water quality and availability. Water quality assessment in this study involves evaluation of the chemical, and nature of water in relation to natural quality, human effects, and intended uses
Objectives
1. To assess the quality of ground water in
Khartoum state and to recommend it’s the
utility
2. To use GIS tools to map, query and analyze the spatial patterns of ground water in khartoum state
3. Create maps use to visualize, analyze, and understand the relationship among the measured points
Study area:
Khartoum State and Study Area
Khartoum is the capital and second largest city of the Republic of Sudan and of Khartoum State. It is located at the confluence of the White and Blue Niles at 370 meters above sea level known as the "al-Mogran"... The state cover an area of 20970 km and the rainfall mean 139-159 mm. It is situated between latitudes 15º26’and 15º45’N
and longitudes 32º25’ and 32º40’E. The terrain in this
region is generally flat or gently sloping; only interrupted by occasional hills of rocky outcrops while sand dunes provide a gently undulaing topography. This flat landscape is also broken by the floors and terraces of the Nile valleys.An estimated overall population of over five million people consisting of Khartoum properو and linked by bridges to Khartoum North called (al-Khartoum Bahre) and Omdurman (Umm Durman) to the west. Khartoum features a hot desert climate, with only the months of July and August seeing significant precipitation. Khartoum averages a little over 155 millimeters (6.1 in) of precipitation per year. Based on annual mean temperatures, it is one of the hottest major cities in the world. Temperatures may exceed 53 °C (127 °F) in mid-summer. Its average annual high temperature is 37.1 °C (99 °F), with six months of the year seeing an average monthly high temperature of at least 38 °C (100 °F). Further more, none of its monthly average high temperatures falls below 30 °C (86 °F). This is something not seen in other major cities with hot desert climates. Temperatures cool off considerably during the night, with Khartoum's lowest average low temperatures of the year just above 15 °C (59 °F
³
Legend
KHARTOUM_study Area
KHARTOUM_STATE AREA
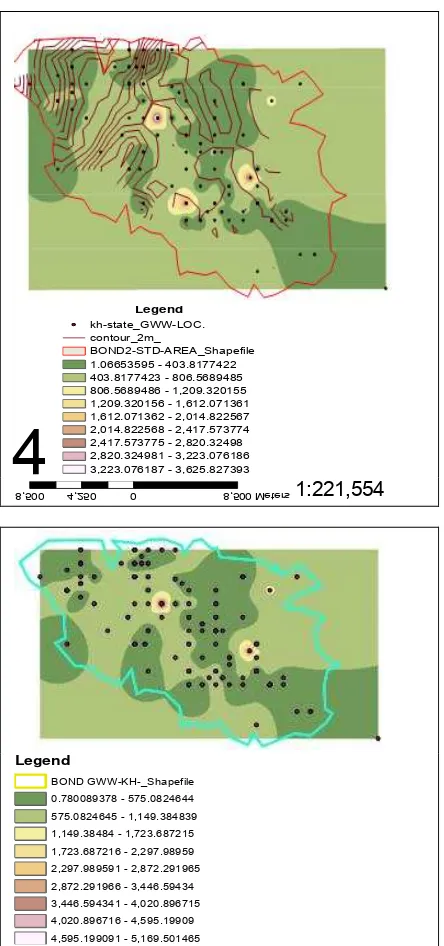
Fig (1)khartoum Digital elevation model extracted from Global DEM /Esri 2014, and fig (2) countor Elivation
Ground water occurrence:
The major water bearing formations in the state are the Nubiansandstone, El Gazira formation and the alluvial wadi deposits in addition to the weathered and /or fractured basement complex rock aquifers
The storage capacity of the Nubian sandstone aquifers is estimated to be 77 billion cubic meters up to the depth of 150 meters below the ground surface, and that of El Gezira formation aquifer is estimatedto be 8.3 billion of cubic meters. The annual discharge from the aquifers is estimated to be about 70 million cubic meters the annual storarge change in the area close to Niles is estimated to be about 100 million cubic meters .the salinity of the water in the basement rocks varies from 1400 to 4700 ppm.the Nubian sandstone aquifer generally have TDS-values range from 200 to about 500 ppm,except in some areas where the maximum TDS valuies range from700 to 5500 ppm.the salinity in El Gazira formation aquifer varies from 200 ppm to 2000 ppm . However some higher values of TDS are encountered in some parts of the state.
(Source: Khartoum state data book, GWWR, information centre, (1991)
Fig (3) show study area boundary, we lls Location and Countor Elivation
Methodology: Fig (5) Flow chart of the method adopted
DATA COLLECTION
FIELD WORK SPATIALDATA
COLLECTION OF WATER
SAMPLES
GENERATING FINAL STUDY
MAPS LABORATORY
ANALYSIS
CREATION OF WQ DATA ON EXCIL FILE
JOIN TABLE WITH SPATIAL
DATA
GENERATION OF THIMATIC MAPS FOR EATCH PARAMETERS USING INTERPOLATION TECHNIQUE
THROUGH IDW
GWW PARAMETERS THIMATIC MAPS INTERPRITATION IMPORT TO ARC/
GIS AND PROJECTED IN
METER AND CONVERT TO POINT FEATURE
AND ASIGHN ID FOR EACH WELL
IDENTIFY WELLS LOCATION USING GPS
DIGITIZE STUDY AREA FROM CATCHMENT MAP DEVELOPED BY HYDRO TERRAIN AND ARC MAP
SPATIAL DISTRIBUTIN OF GWW WATER QUALITY FOR DRINKING
AND FOR IRRIGATION 576
557
538
518
499
480
Ground water collection and analysis
Groundwater samples are collected from 159 Borehole wells, representing the three regions (Khartoum, Oumdorman and Khartoum Bahre the samples taken during 2014 and analyzed for various physico-chemical parameters.A clean Bottles are used for water sample collection. After collection of the samples, the samples are preserved and shifted to the laboratory for analysis. Physico-chemical analysis was carried out to determine TDS, Cl-, NO3-, SO4, F, NO3, Ca, Mg, and Na, and compared with standard values recommended by World Health Organization (WHO,) andsudanese Standard (2008)
Table :(1)Drinking water: Parameters and Recommended Permissible limits
Parameters WHO
Standard
Sudanese standard Total
dissolved solid (TDS)
1000 ppm 1500 ppm
Chloride 250 mg/l 250 mg/l
Sulfate 250 mg/l 250 mg/l
Nitrate as NO3
50 mg/l 50 mg/l
Soduim 200 mg/l 250 mg/l
Flouride 2.0 mg/l 1.5 mg/l
As groundwater in khartoum state is extensively used for drinking purpose and a previous studies report that pollution is mainly due to sewage disposal , The report mention that the average urine for an ordinary person is 400-500 litr per year and his stool 50 litr per year,then one person need 15000 litr of clean water for transporting his urine.We can conclude that there is tow ways for transporting the domestic and industrial liquid waste, first one on site disposal on remote area or through pit latrines .Also another method inform of septic tanks and soak aways. The negative environmental impacts from this type of disposal are hazard to soil and lead to ground water pollution (UNESCO-Chair report on 2010), the water quality testing in this study is concentrated to measurement of salinity (TDS,) Flouride as a natural occurance in rocks, and has an effect in human health, and determination of potential contamination by sewage. The major indicators of sewage contamination, Cl- and NO3- , are considered for the analysis. One of the sources of Nitrate is on-site disposal systems such as septic tanks, and agrochemical mainly fertilizer.
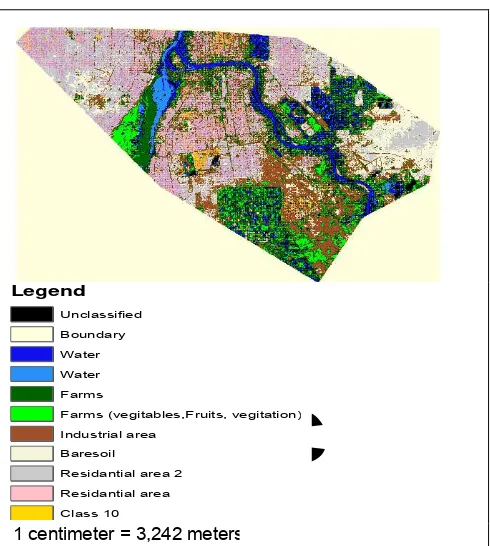
Khartoum State , study area Land use /land cover, created from 2013 mosaic image
Inverse distance weighting (IDW)
In interpolation with IDW method, a weight is attributed to the point to be measured. The amount of this weight is dependent on the distance of the point to another unknown point. These weights are controlled on the bases of power of ten. With increase of power of ten, the effect of the points that are farther diminishes. Lesser power distributes the weights more uniformly between neighboring points. In this method the distance between the points count, so the points of equal distance have equal weights.The weight factor is calculated with the use of the following formula:
(1)
The weight of point, Di = the distance between point i and the unknown point, = the power ten of weight.
The advantage of IDW is that it is intuitive and efficient. This interpolation works best with evenly distributed points. Similar to the SPLINE functions, IDW is sensitive to outliers. Furthermore, unevenly distributed data clusters result in introduced errors
Legend
Unclassified
Boundary
Water
Water
Farms
Farms (vegitables,Fruits, vegitation)
Industrial area
Baresoil
Residantial area 2
Residantial area
Class 10
³
Criteria for Acceptability and Rejection in Water Quality for Dinking:
In this stage, the criteria for suitability and non-suitability of the water samples were selected for analysis. This was performed based on the water quality standards stipulated by the WHO, and Sudanese standard (2008). Ranks were assigned for each parameter depending on the guideline
Table (2) Criteria for acceptability and rejection
Ground Water Quality Mapping:
Six thematic maps for the parameters of chloride concentration, sulfate, flouride, nitrate, TDS and EC were integrated using the ArcGIS software. We created a final drinking-water groundwater quality map by overlaying these four thematic maps which are produced as a result of inverse distance weighted (IDW) interpolations. The spatial integration for final groundwater quality zone mapping was carried out using ArcGIS Spatial Analyst extension. We then delineated tow areas within the study area based on the quality of the groundwater for drinking purposes: potable and non-potable zone
Result and Discussion:
Groundwater quality maps are useful in assessing the usability of the water for different purposes. Figures 6, 7, 8, 9, 10, and 11 show the spatial distribution, total dissolved solids, electrical conductivity, chloride, sulfate, flouride distribution and nitrate concentrations in study area. A ground water quality map is created for each parameter following the classification shown in table (2)
Fig (6) - Gww -Total Dissolved Solid (TDS) mg\l Salinity hazard
The total concentration of dissolved minerals in water is a general indication of the over-all suitability of water for many types of uses
4
8,500 4,250 0 8,500Meters
1:221,554
Legend
rank criteria remarks
Fig (7)Electrical conductivity distribution mg/l (E.C us/cm)
The above thematic maps show that there are some area south and south east of khartoum state with high salinity, were the TDS more than 1000 mg/l.While the rest of the area consider as a potable water (TDS less than 1000 mg/l (see table 1),we can select a suitable area with water quality acceptable for drinking water and we can drill wells according to the other intended use. Also the spasial distribution show that there is adirect relation betwween Electric conductivity and total dissoved solid, that is to say if there is an incease in TDA, followed increased in electrical conductivity
Fig (8)Chloride Distribution mg/l (CL)
Water with high chloride content usually has an unpleasant taste and may be objectionable for some agricultural purposes.from the map we see there is 14 wells out of 159 with chloride concentration more than a permisiple limit (>250 mg/l), while 91% of the well with CL concentration suitable for drinking
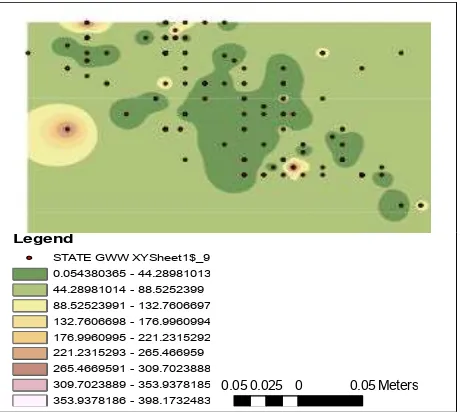
Fig (9) Sulfate Distribution mg/l (SO4)
Ground- water Quality Map for sulfate distribution (Figure 9) derived shows only 6 wells out of 159 with high sulfate concentration mainly in south khartoum and part of the city where the groundwater with SO4 concentration more than permisiple limit (250 mg/l) , and 98% of wells within the permisiple limits(WHO standard)
Fig (10) Flouride Distribution mg/l (F)
flouride found in a rock formation, which is natural occurant , flouride in ground water has a health effect to human being .
The main source of nitrate in water is from atmosphere, legumes, plant debris and animal excreta (WHO). (Nitrate in groundwater generally originates from sewage effluents, septic tanks and natural drains carrying municipal wastes. NH4+ from organic sources is converted to NO3- by oxidation. Concentrations of NO3- commonly reported for groundwater are not limited by solubility constraints. Because of this and because of its anionic form NO3- is very mobile in groundwater.nitrare MCL 50 mg/l (WHO).In Khartoum state NO3 high concentration only in 3 wells from 159, and 98% of the wells with low NO3, indicating that the north west area and south west in the state affect with sewage disposal and natural drain from animal mannure, pit latrines, and septic tank
Legend
STATE GWW XYSheet1$_9 0.155483171 - 41.14395813 41.14395814 - 82.13243309 82.1324331 - 123.1209081 123.1209082 - 164.109383 164.1093831 - 205.097858 205.0978581 - 246.0863329 246.086333 - 287.0748079 287.074808 - 328.0632829 328.063283 - 369.0517578
0.070.035 0 0.07Meters
Legend
STATE GWW XYSheet1$_9 0.054380365 - 44.28981013 44.28981014 - 88.5252399 88.52523991 - 132.7606697 132.7606698 - 176.9960994 176.9960995 - 221.2315292 221.2315293 - 265.466959 265.4669591 - 309.7023888 309.7023889 - 353.9378185 353.9378186 - 398.1732483
0.050.025 0 0.05Meters
Legend
STATE GWW XYSheet1$_9
0.000213412 - 0.554228966 0.554228966 - 1.10824452
1.108244521 - 1.662260074
1.662260075 - 2.216275628 2.216275629 - 2.770291182
2.770291183 - 3.324306736 3.324306737 - 3.87832229
Fig (11) Nitrate Distribution mg/l (NO3)
Fig (12)Potable and non Potable Wells spacial distribution
Determination needed to evalute common irrigation water quality problems
Soduim adsorption ration (SAR ) a formuler are used to evalute salinity hazard and whether the water quality of the Ground water suitable or not accebtablity for Irrigation uses see table (3).SAR is calculated from the Na, Ca ,and Mg reported in meq/l
SAR= Na / √
(2)
Where: SAR = Sodium adsorbtion Ratio Na= Sodium, Ca= calsium , Mg = Magnisium
Table(3) laboratory determination needed to evalute common irrigation water quality problems
Water parameter
symbol unit Acceptable range in
Note that: Mg/l=milligram per litre= parts per million (ppm) , meq/l= milliequivalent per litre (mg/l Divided by equivalent weigt
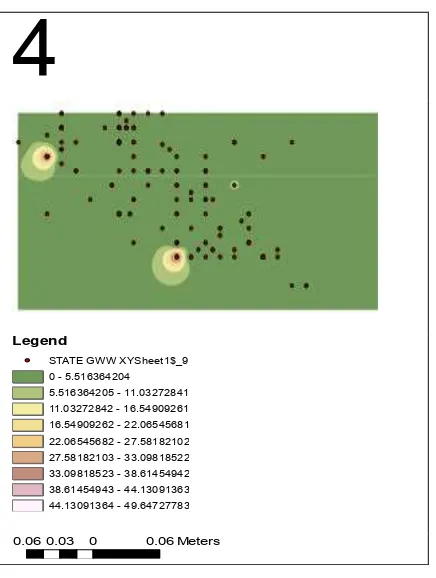
Fig (13) Khartoum State GWWR Sodium Absorbtion Ratio (SAR). The evaluation of ground water quality and it sutablity for irrigation using distribution of SAR , indicating that 98%of wells suitable for irrigation with SAR less than 10 see (fig 12),and only few wells with SAR more than 10 found in area south khartoum
4
0.060.03 0 0.06Meters
Legend
Conclution
After the overlay of critical parameters for potable and non-potable zones in khartoum state, the final Ground- water Quality Map (Figure 13) derived shows only a small region in the -eastern part of the city where the groundwater is not potable.and 98% of the state ground water are potable for drinking . Assessment of ground water quality and its suitablity for irrigation and agriculture by using sodium absorbtio ratio (SAR) and salinity hazard,indicating that 97% of the existing wells in khartoum state with SAR less than 10 which accebtable for irrigation, while few wells which exist south of khartoum are saline with SAR more than 10 . The spatial distribution analysis of groundwater quality in the study area indicated that many of the samples collected are satisfying the drinking water quality, and irrigation purposes
Refrence;
- IHP PHASE V (1999-2001), Vulnerablity of ground water resources of Sudan to pollution risks
-Lenore S. Clescerl, (1998), Standard methods for examination of water and waste
- Jerry C. Ritchie, Paul V. Zimba, and James H. Everitt,
2003,”Remote Sensing Techniques to assess Water Quality” Photogrammetric Engineering & Remote
Sensing Vol. 69, No. 6, June 2003, pp. 69
- Mohsin Jamil and Majid Nazzeer, 2009 “Assessment of water quality parametersof Rawal Lake using Satellite remote sensing, COMSATS Institute of information Technology, Islamabad
- Ravikumar.M 1, Nagaraju.D 1, Mahadevaswamy.G, (2011),” Groundwater pollution sensitivity model for part of Cauvery
basin between Mettur dam and Erode town using Remote Sensing and GIS, International Journal of Geomarics and Geosciences Volume 1, No 4, 2011,
- P. Balakrishnan1*, Abdul Saleem2 and N. D.
Mallikarjun2, (2011). “Groundwater quality mapping using geographic information system (GIS) “, ISSN
1996-0786 ©2011 Africa Academic Journals
- Yosif I, OMER A.I, Basheer.M.H, 2010 ,”Assessment of water supply sources and systems of potable water in khartoum metropolitan in relation to liquid waste
disposa”l, NBCBN Sudan Node, UNESCO Chair in
Water Resources
- UNEP/WHO, 1996, “Water Quality Monitoring - A Practical Guide to the Design and Implementation of Freshwater
Quality Studies and Monitoring Programmes” ISBN 0 419 22320 7 (Hbk) 0 419 21730 4 (Pbk)
- World Health organization (WHO), 1993,”Guidline for drinking water quality), volume 1 and 2, Ginava Legend
kh-state_shepe