APPLICATIONS OF PHOTOGRAMMETRY FOR ANALYSIS OF FOREST
PLANTATIONS. PRELIMINARY STUDY: ANALYSIS OF INDIVIDUAL TREES
R. Mora-Zamoraa,∗, A. Barahona-Contrerasa, H. Aguilar-Ariasa
aCeNAT, PRIAS Laboratory, San José, Costa Rica - (rmora, abarahona, haguilar)@cenat.ac.cr
KEY WORDS:Photogrammetry, Stem Volume, Stem Diameter
ABSTRACT:
This paper presents a method for using high detail volumetric information, captured with a land based photogrammetric survey, to obtain information from individual trees. Applying LIDAR analysis techniques it is possible to measure diameter at breast height, height at first branch (commercial height), basal area and volume of an individual tree. Given this information it is possible to calculate how much of that tree can be exploited as wood. The main objective is to develop a methodology for successfully surveying one individual tree, capturing every side of the stem a using high resolution digital camera and reference marks with GPS coordinates. The process is executed for several individuals of two species present in the metropolitan area in San José, Costa Rica,Delonix regia(Bojer) Raf.
andTabebuia rosea(Bertol.) DC., each one with different height, stem shape and crown area. Using a photogrammetry suite all the
pictures are aligned, geo-referenced and a dense point cloud is generated with enough detail to perform the required measurements, as well as a solid tridimensional model for volume measurement. This research will open the way to develop a capture methodology with an airborne camera using close range UAVs. An airborne platform will make possible to capture every individual in a forest plantation, furthermore if the analysis techniques applied in this research are automated it will be possible to calculate with high precision the exploit potential of a forest plantation and improve its management.
1. INTRODUCTION
Traditionally manual instrumentation has been the main approach as a measurement method for individual trees in a forest planta-tion. These manual methods include meter tapes, diameter tapes, calipers and prisms to determine diameter. Telescopic bars, Blume-Leiss hypsometers, Haga altimeters, Suunto inclinometers to per-form direct measurements of tree height. However, equipment cost, and lack of access and clearance required by these instru-ments have led to the research of new tools, many of them digital, to perform the same measurements.
Recently remote sensing systems have been on the spotlight of re-searchers interested in topics such as forest mass and growth. Es-pecially photogrammetry has been applied in several studies with different strategies in order to calculate wood volume of an indi-vidual tree captured in photographs. For instance, (Dean, 2003) calculates the volume of an individual tree taking as a starting point a single photograph of the subject along with a calibrated reference framework. In this study volume data obtained from the photograph is multiplied by a specific taper factor for the stem.
Another remarkable example in photogrammetry applications is the study by (Larsen, n.d.), in which several photographs, taken from different positions around the subject, are processed to cal-culate a taper profile for the individual. In (Knyaz et al., n.d.), volume for a package of cut trees is estimated using 3D models from video camera stills and a custom made software for a wood-working facility.
Both species selected for this paper are part of the biodiversity present in the whereabouts of the National Center for Advanced Technologies (CeNAT), and this paper aims to test an applied method for individual tree measurement using photogrammetry techniques, that could be applied later on a forest plantation as a resource to determine forest growth.
∗Corresponding author.
1.1 PHOTOGRAMMETRY
Photogrammetry is a technique of image analysis that allows ob-taining volumetric information from different photographs of the same target. By measuring differences in position and angle of each take it’s possible to reconstruct the object in a digital 3D model and even characterize it through its dimensional proties. Along with the digital era and emergence of higher per-formance computers of the last decade, it’s possible to perform a photogrammetric process of a large number of photographs, as well as production of digital models (Lerma-García, 2002). If a photogrammetric model is going to be used as a measur-ing tool for obtainmeasur-ing information from the target, calibration is mandatory, this can be achieved by including a calibrated refer-ence framework along with the target captured. For this study several strategies for this framework were tested, being the most successful the placing of three reference markers in an equilateral triangle aligned to the geographic north with a single geographic coordinate for the first marker. This approach yielded a preci-sion in measuring of 3 millimeters. (More detail of the reference framework will be discussed in section 2.5.1).
2. METHODS
2.1 Area of study
The research took place in the whereabouts of the Centro Na-cional de Alta Tecnología, Franklin Chang Díaz facilities, in the city of San José, Pavas district, 9o57’01.30” North, 84o07’26.87” West, Costa Rica. According to (Ortíz, 2014), this location has use capacity IV (Agricultural with strong limitations) surrounded by urban use. Inside the facilities are permanent infrastructure and green areas with forest specimens as Tabebuia rosea, De-lonix regia,Spathodea campanulataP. Beauv,Eriobotrya japon-ica(Thunb.) Lindl.,Parkinsonia aculeataL. and several
2.2 Species selection
Given specimens density the facilities of CeNAT, three specimens ofD. regia (malinche), as shown in Figure 1, and three
speci-mens ofT. rosea(roble sabana), Figure 2 where selected as sub-jects. Roble sabana’s natural extent comprises Mexico, Central America (including Panama), Colombia and Venezuela. In Costa Rica it’s distributed along the Pacific Slope, including regions of Guanacaste, Puntarenas, Puriscal, Valle Central and Zona Sur in-cluding Osa Península, from 0 to 1200 meters above sea level. A roble sabana can reach from 5 to 20 meters in height and from 25 to 75 centimeters in diameter. It’s wood has several applications, from construction, tool crafting and paper industry (Sánchez and Cascante, 2008). A specimen of malinche, on the other hand, can be up to 20 meters high and around 50 centimeters wide (stem diameter), with a crown spread out in a horizontal pattern. This species is native of Madagascar, but can be found in tropical areas as ornamental. In Costa Rica, malinche specimens can be found in almost every urban area countrywide between 0 and 1200 me-ters above the sea level. Produces flowers from May to June and it’s fruits remain attached to the tree for almost a year (Sánchez and Cascante, 2008).
Figure 1: D. regia specimens sampled.
Figure 2: T. rosea specimens sampled.
2.3 Measurement and variable estimation
2.3.1 Diameter at breast height (DBH) By means of a meter tape, tree circumferenceCwas measured in centimeters, about 1.3 meters from the surface. OnceCis taken the Equation 1 was applied to obtain
DBH= C
π (1)
2.3.2 Height Commercial height was measured with a meter tape taking the distance between above the roots and below the first thick branch. In the scope of this paper this is considered as the commercial segment of the tree and the same criteria is applied to trim the digital model later on Section 2.5.3
2.3.3 Basal area Equation 2 was applied to obtain basal area:
G=DBH2∗π
4 (2)
WhereG= Basal area in m2,DBH= Diameter at breast height in m.
2.3.4 Volume For the estimation of volume a simple cylindri-cal volume is cylindri-calculed, taking the basal area as the base of the cylinder and commercial height as height of the cylinder. An ad-ditional taper factor is included in the equation to penalize volume in order to include shape deformation of the tree stem into the es-timation. Equation 3 is the estimation of commercial volume of the tree, given in m3.
V c=G∗Hc∗F f (3)
WhereV c= Commercial volume in m3,G= Basal Area in m2, Hc= Estimated commercial height (height from above the roots to below the first thick branch) in m,F f = Taper factor for the species, in both species the value taken was 0.45.
2.4 Photogrammetry process
2.5 Equipment and software
The photographs captured for this study where taken with a semi-professional digital camera model Canon EOS Rebel T2i with a Canon EFS 18-55mm Lens. Each photograph taken has 3456 pix-els width per 5184 pixpix-els height (pictures where taken in portrait to maximize subject data inside the frame). Agisoft Photoscan is the processing software used to align the pictures and generate the photogrammetric model. Photographs were previously calibrated using Agisoft Lens and the official manufacturer’s specification for the camera en lens. Blender 2.73 was used to refine solid 3D models generated in Agisoft and exported in .OBJ format.
2.5.1 Reference framework Agisoft Photoscan features a tool for generating reference markers, these markers are catalogued by the software and their patterns are automatically recognized during the alignment process, which make them very convenient for the application in this study. The reference framework is a square panel of 36 inches side with three markers located as the vertices of an equilateral triangle centered in the panel. Addition-ally a north arrow is located in the top-left corner of the panel, allowing the alignment of the panel with the geographic north. The distance from the center of each marker to each other is 53.4 centimeters with a error margin of 2 millimeters. The layout and final result are illustrated in Figure 3 and Figure 4 respectively.
Figure 3: Layout of reference panel.
Figure 4: Reference panel final art.
These pictures would help later as tie shots between the reference framework and the target. Right after these preliminary steps, two bursts of shots were taken in a full circle around the subject covering every angle possible, the first burst captures the roots and stem, the second burst captures the stem and crown, both at an average distance of 5 meters away from the target. In total 100 to 135 pictures were taken for each subject, plus approximately 13 additional tie shots. In every case where the crown and stem didn’t fit a single frame, a minimum 20% overlap between the lower and upper circle was guaranteed.
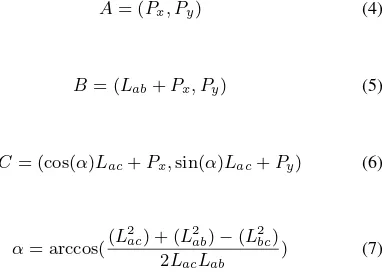
2.5.3 Processing and model generation Before processing the data set, the geographic system must be assigned to the refer-ence frame. First the coordinates for markerAare translated to CRTM 05 Coordinate Reference System (CRS), the official for Costa Rica, this CRS has the additional benefit that the coordi-nates are expressed in meters and the projection is planar, simpli-fying the equations required to calculate coordinates for markers BandC. HavingAas the origin of the local coordinate system, and the segmentABperpendicular to the north axis, and taking
P as the geographic location ofAexpressed in meters, where Pxis the longitude andPyis the latitude, the geographic
coordi-nates ofA,BandCcan be calculated by equations 4, 5 and 6 respectively:
A= (Px, Py) (4)
B= (Lab+Px, Py) (5)
C= (cos(α)Lac+Px,sin(α)Lac+Py) (6)
α= arccos((L
2
ac) + (L2ab)−(L2bc) 2LacLab
) (7)
WhereLabis the length of segment AB, Lbcis the length of
segmentBCandLacis the length of segmentAC.
Once the coordinates for the reference framework are ready, the dataset is calibrated with Agisoft Lens and then included in an Agisoft Photoscan project in three different chunks. The first chunk is comprised by the tie shots, the markers are recognized automatically by the software, if any of the markers is not identi-fied correctly, it can be assigned manually by the user. Next the entire subset is calibrated with the coordinates of the markers, al-lowing the whole model to scale accordingly to real world dimen-sions. In this part of the process it’s possible to verify the model precision. The second and third chunks correspond to the lower and upper rings of shots around the subject, note that if the subject fits entirely in frame, the upper ring is not required to reconstruct the model. During the alignment process the software searches visual patterns shared by any two or more pictures inside a chunk and, based on differences in distance and size between patterns, each shot is aligned in a spatial reference frame that is, at the same time, aligned with the coordinates of the reference mark-ers previously identified. The final alignment step is to merge the chunks into one single dataset. This strategy (three separate chunks merged afterwards) reduces noise during the alignment process and improves precision. At this point a sparse point cloud is generated by the software and every picture used in the process has already a spatial reference in a georeferenced tridimensional space. With the pictures aligned the software can generate a dense point cloud that increases detail drastically, this point cloud is al-ready a viable model for analysis. The dense point cloud can be manually trimmed, removing noise and unused data from the model (only the section of the stem between above the roots and below the first thick branch is considered for the volume estima-tion). Afterwards a solid 3D model is generated that can be ex-ported to a 3D design software, like Blender, for refinement (and imported back to Agisoft seamlessly).
3. RESULTS
3.1 Precision analysis
The distance between the reference markers reported by the model is taken as input to verify the error of the model. Table 1 sum-marizes distances for each marker to each other and maximum distance error.
Tree B-C(m) A-C(m) A-B(m) Error(mm) M1 0.534168 0.533175 0.534883 0.883
R1 0.533987 0.533391 0.534850 0.850 R2 0.534000 0.533289 0.534937 0.937 M2 0.532387 0.533776 0.536048 2.048 M3 0.532387 0.533776 0.536048 2.048 R3 0.533653 0.533600 0.534974 0.974
Table 1: Model distance from each marker to each other ex-pressed in meters and maximum distance error exex-pressed in mil-limeters.
As appreciated, error for distances measured in the model is close to 3mm in every subject, yielding a general model precision of less than 3mm for distance measurements. Note that the meter tape used to measure distance of markers directly on the reference panel has an uncertainty of 1mm and for trees M1, R1, R2 and R3 error in distance is actually under instrument uncertainty.
3.2 Diameter and volume comparison
Table 2 demonstrates that the diameter captured in the field has several discrepancies towards diameter captured using the soft-ware tool. Both measurements assume the tree is cylindrical, however the capacity to measure average diameters might in-crease the confidence of this variable when captured with from the photogrammetric model.
Tree Common Name Manual DBH(m) Digital DBH(m)
M1 malinche 0.6175 0.5487
R1 roble sabana 0.6239 0.7225
R2 roble sabana 0.5523 0.7305
M2 malinche 0.5698 0.5983
M3 malinche 0.7624 0.7230
R3 roble sabana 0.5952 0.6622
Table 2: Diameter comparison between manual method and pho-togrammetric (digital) approach.
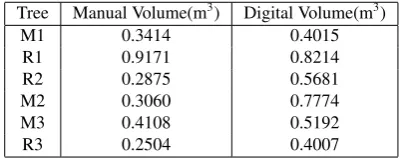
Regarding volume, Table 3 demonstrates that volume calculated using the equations proposed in Section 2.3 present a solid ten-dency to underestimate volume of the subject when compared to the results of volume calculated using the refined solid 3D model inside of Agisoft Photoscan.
Tree Manual Volume(m3) Digital Volume(m3)
M1 0.3414 0.4015
Table 3: Volume comparison between manual and digital meth-ods.
4. CONCLUSIONS
According to the precision and final results analysis, it is possible to conclude the following statements:
1. Results from the manual method include uncertainty inher-ent to several assumptions about the shape of the tree, this assumptions render impossible to establish a direct numeri-cal error to the estimation, in contrast the photogrammetric approach takes into consideration the entire volume of the analysed tree section and applies an arithmetic approach to calculate volume, yielding a direct numerical error derivable from the original precision of the model.
2. As a direct consequence of the last statement, the photogram-metric approach for volume measurement is more precise than the manual approach exposed in this study.
3. It is possible to measure diameter of the exploitable section of the tree with higher precision, when using photogram-metric analysis in contrast to the manual method studied. 4. The manual method and proposed equations present a solid
tendency to underestimate volume of the tree segment as calculated by the tool provided by the photogrammetric suite. Higher precision and removal of underestimation could rep-resent a direct positive impact on profit for the owner of a forest plantation.
5. The photogrammetric method proposed presents potential new features that are not possible using the manual method. For instance:
• The technique could impact on a cost reduction for
a plantation owner, as less technicians would be nec-essary to capture data on the field (one for the pho-togrammetric approach in contrast to minimum 3 for the manual approach).
• The technique could allow a more precise analysis of
the exploitable wood of standing trees, it would be possible to measure wood volume of thick branches and other features of the tree that are neglected due to difficulties of measurement of standing trees.
• It could be feasible to calculate actual saw logs
di-rectly from standing trees, optimizing benefit ratio of the plantation, using only the photogrammetric suite and a 3D design tool as blender.
5. RECOMMENDATIONS AND LIMITATIONS
Given the scope of this study, is not possible to determine if re-sults will remain for a higher scale, it is recommended that the experiment developed in this paper is reproduced with a higher sample, using different wood exploitable species in actual forest plantations. As well it is recommended to repeat the experiment with other manual methods used to estimate exploitable wood in a forest plantation.
The data capture approach proposed for generating and calibrat-ing the photogrammetric model was refined empirically, rein-forced by the official documentation provided by the software manufacturer, an experiment focused in precision improvement for photogrammetric models using the same tools and conditions as this paper could enrich the results of this study and it’s deriva-tives, if any.
REFERENCES
Knyaz, V., Visilter, Y. and Zheltov, S., n.d. Photogrammetric tec-niques for measurements in woodworking industry. International Society for Photogrammetry and Remote Sensing.
Larsen, D., n.d. Development of a photogrammetric method of measuring tree taper ouside bark. In: K. F. Connor (ed.), Pro-ceedings of the 13th biennial southern silvicultural research con-ference, Department of Agriculture, Forest Service, pp. 347–350.
Lerma-García, J., 2002. Fotogrametría Moderna: analítica y dig-ital. Editorial Universitat Politècnica de València. Reprinted in 2012.
Ortíz, E., 2014. Atlas Digital de Costa Rica 2014. Instituto Tec-nológico de Costa Rica.