ﺔﯿﺑﺮﻌﻟا لوﺪﻟا تادﺎﺼﺘﻗا ﻰﻠﻋ ﺔﻣﺎﻋ ةﺮﻈﻧ مﺎﻋ لﻼﺧ
لوﻷا ﻞﺼﻔﻟا) ﺔﯿﻟوﺪﻟا ﺔﯾدﺎﺼﺘﻗﻻا تارﻮﻄﺘﻟا
ﻲﻧﺎﺜﻟا ﻞﺼﻔﻟا) ﺔﯿﻋﺎﻤﺘﺟﻻاو ﺔﯾدﺎﺼﺘﻗﻻا تارﻮﻄﺘﻟا
ﺔﯿﻋﺎﻤﺘﺟﻻا تارﻮﻄﺘﻟا ﺖّﻠﺜﻣ
ﺚﻟﺎﺜﻟا ﻞﺼﻔﻟا) عﺎﻄﻗ
ﻊﺑاﺮﻟا ﻞﺼﻔﻟا) ﻲﻋﺎﻨﺼﻟا عﺎﻄﻘﻟا
سدﺎﺴﻟا ﻞﺼﻔﻟا) ﺔﯿﻟﺎﻤﻟا تارﻮﻄﺘﻟا
ﻟا ﻞﺼﻔﻟا)(ﺲﻣﺎﺨ
ﺔﻗﺎﻄﻟاو ﻂﻔﻨﻟا لﺎﺠﻣ ﻲﻓ ﺔﺴﯿﺋﺮﻟا تارﻮﻄﺘﻟا تﺪﮭﺷ
ﻊﺑﺎﺴﻟا ﻞﺼﻔﻟا) ا
لﺎﻤﻟا قاﻮﺳأ ﺔﯿﺑﺮﻌﻟا لوﺪﻟا ﻲﻓ
ﺮﺷﺎﻌﻟا ﻞﺼﻔﻟا) (ﺮﯾﺮﻘﺘﻟا رﻮﺤﻣ ﻞﺼﻓ)
ﻞظ ﻲﻓ ﺪﯿﻓﻮﻛ ﺔﺤﺋﺎﺟ
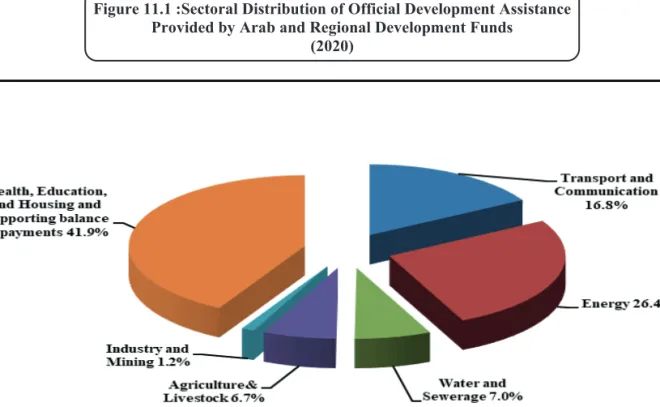
ﺮﺸﻋ يدﺎﺤﻟا ﻞﺼﻔﻟا) ﻲﺑﺮﻌﻟا ﻲﺋﺎﻤﻧﻹا نﻮﻌﻟا
ﺮﺸﻋ ﻲﻧﺎﺜﻟا ﻞﺼﻔﻟا) ﺼﻓ)
ﺮﺜﻛأ ىﺪﺣإ ﺮﻔﺴﻟاو ﺔﺣﺎﯿﺴﻟا عﺎﻄﻗ ﻲﻓ ﻲﺑﺮﻌﻟا نوﺎﻌﺘﻟا
ﺪﯿﻓﻮﻛ ﺔﺤﺋﺎﺟ تﺎﯿﻋاﺪﺗ ﻦﻣ ًارﺮﻀﺗ تﺎﻋﺎﻄﻘﻟا-
ﺔﯿﺋﺎﺼﺣﻹا ﻖﺣﻼﻤﻟا
Source: Joint Arab Economic Report Questionnaire of 2021, and the Palestinian Monetary Authority based on the data of the Central Bureau of Statistics and the Ministry of Finance. Highlights of the Palestinian Economy Source: Joint Arab Economic Report Questionnaire of 2021, and the Palestinian Monetary Authority based on the data of the Central Bureau of Statistics and the Ministry of Finance.
Annex Table (12/1) The Impact of International Crises on the Global Economy, Travel and Tourism Sector Crisis
Annex Table (11/6)
Source: Secretariat of the Coordinating Group of Arab Development Institutions at the Arab Fund for Economic and Social Development (AFESD). Source: Secretariat of the Coordinating Group of Arab Development Institutions at the Arab Fund for Economic and Social Development (AFESD).
Annex Table (10/3) : Economic Reforms Priorities in the Arab Countries after COVID-19
Annex table (10/3): Economic reform priorities in the Arab countries after COVID-19 in the Arab countries after COVID-19. 34; Joint Arab Economic Report Questionnaire: Economic Reform Priorities in the Arab Countries in the Aftermath of the Coronavirus Pandemic".
Annex Table (9/14) : Change in Real Effective Exchange Rate of the Arab Countries * Country 20162019201720182020Average Annual Change (%)
Annex table (9/13) : Exchange rates of the Arab countries: National Currency Units per S DR (average in period The annual change is calculated on the basis of the National Currency Units in relation to the Special Drawing Rights (SDR) unit; the sign (-) indicates an increase in the value of the national currency in question 1) The annual change was calculated on the basis of the national currency units in relation to the euro; the sign (-) indicates an increase in the value of the national currency in question. Annex table (9/11): Exchange rates of the Arab countries: National currency units per U. 1) The annual change was calculated on the basis of the national currency units relative to the dollar; the sign (-) indicates an increase in the value of the national currency in question.
Annex Table (9/9): External Public Debt Service to Exports of Goods and Services (2016-2020)
Annex Table (9/8): Outstanding External Public Debt to GDP (2016-2020)
Annex Table (9/7): External Public Debt Service of Borrowing Arab countries (2016-2020)
Annex Table (9/6): Outstanding External Public Debt of Borrowing Arab Countries (2016-2020)
Annex Table (9/5): Official Foreign Reserves of the Arab Countries (in Months of Imports) (2016-2020)
Annex Table (9/4): Official Foreign Reserves of the Arab Countries * (2016-2020)
Annex Table (9/3): Current Account Balance of Arab countries to GDP (2016-2020)
Annex Table (9/2): Trade Balance of Arab Countries to GDP (2016-2020)
Source: Joint Arab Economic Report Questionnaire of 2021; United Nations Conference on Trade and Development (UNCTAD) database; and Arab Monetary Fund estimates. Source: Joint Arab Economic Report Questionnaire of 2021; International Trade Center ITC (PC-TAS database); and United Nations (UNSTAT), Comtrade Database. Source: Joint Arab Economic Report Questionnaire of 2021; International Trade Center ITC (PC-TAS database); and United Nations (UNSTAT), Comtrade Database.
Source: Joint Arab Economic Report Questionnaire 2021, International Trade Center ITC (PC-TAS database) and United Nations (UNSTAT), Comtrade database.
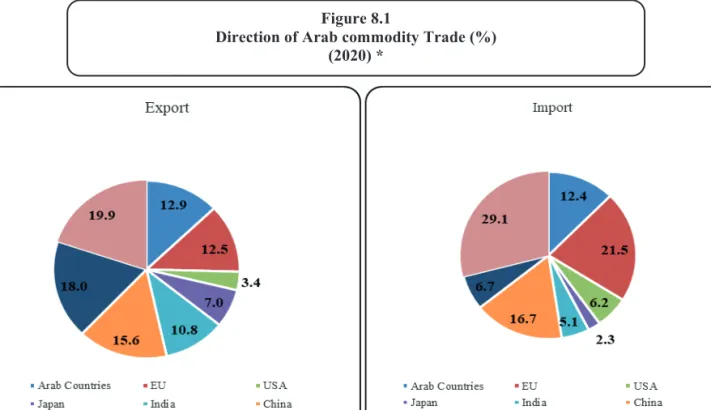
Annex Table (8/7) : Direction of Intra-Arab Trade (2020) *
Sources: Joint Arab Economic Report 2021 questionnaire; ITC International Trade Center (PC-TAS database); and United Nations (UNSTAT), Comtrade database. Sources: Joint Arab Economic Report 2021 questionnaire; ITC International Trade Center (PC-TAS database); and United Nations (UNSTAT), Comtrade database.
Annex (7/10): Arab Capital Markets Performance Statistics (2020) c - Trading Indicators Market / Exchange
Value (million US dollars) Turnover ratio (%) * Value of transactions with foreign investors (million US dollars) Trade value of foreign investors / total trade. Appendix (7/10) : Arab Capital Markets Performance Statistics (2020) a- V olum e Indicators Market / ExchangeNumber of listed companiesListed foreign companiesNumber of listed companiesListed foreign companiesMarket capitalization (billion US dollars)Change of market capitalization (billion US dollars).
2019-2020) Annex Table (7/6): Total Deposits with Commercial Banks in the Arab Countries (1) 20192020
Annex Table (7/5): Total Assets in the Consolidated Balance Sheet of Commercial Banks in the Arab Countries (2019-2020) 20192020Annual Percentage Change (%) (2018-2019)
Annex Table (7/4): Contributions of Factors Affecting the Changes of Domestic Liquidity (2016-2020) Other Items (Net) 2020201820192016201720182019201620172018
Annex Table (7/3): Factors Affecting Domestic Liquidity (Annual Change) (2019-2020) Other Items (Net)
An nex Table (7/1): Annual growth rates for domestic liquidity Source: Joint Arab Economic Report Questionnaire of 2021, Central Banks and Monetary Authorities of Arab Countries. 2020 (1)(Million US Dollars) 2019 ** The current expenditure item includes social transfers, while the capital expenditure includes expenditure on construction, land acquisition and non-movable assets. Government expenditure (millions of US dollars) Sources: 2021 Joint Arab Economic Report Questionnaire and other national and international data sources.
Annex Table (6/6): Public expenditures and net public lending of Arab countries as a percentage of gross domestic product (%) (2) Kuwait's public expenditures are classified into current expenditures, investment expenditures, and expenditures for construction, land acquisition, and real estate.
Share of government revenue and subsidies (%) As a percentage of gross domestic product (%) Tax revenue (millions of US dollars). Appendix table (6/ 2): H y rocarbon revenues for Arab oil and n a t ural gas exporting countries * Sources: Joint Arab Economic Report Questionnaire for 2021, and other national and international data sources.
Annex Table (6/1): Public Revenues and Grants of Arab Countries As a Percentage of Gross Domestic Product (%)
Annex Table (5/7): Value of Oil Exports in Arab Countries (2016-2020)
Annex Table (5/6): Spot Price of OPEC Basket of Crudes*
The OPEC basket reference currently includes fourteen types of crude oil, representing the raw materials of member countries, according to weights that take into account the production and exports of member countries. The OPEC basket reference currently includes fourteen types of crude oil, representing the raw materials of member countries, according to weights that take into account the production and exports of member countries.
Annex Table (5/1): Arab and World Crude Oil Reserves (2016-2020)
The main direct measures taken by Arab countries to reduce the impact of the COVID-19 pandemic on small and medium-sized industrial enterprises. Postponement of the payment of monthly utility bills for light industries until the end of the first half of 2020. The Jordan Enterprise Development Corporation has launched two programs with an amount of 680 million dinars to improve opportunities for small and medium-sized industrial enterprises in light of the consequences of the pandemic.
The creation of an emergency and solidarity fund to reduce the pandemic and the allocation of funds in the amount of one billion Djiboutian francs.
Announcing stimulus packages worth 4.3 billion Bahraini dinars (about $11.6 billion), including several initiatives of which; Exemption of commercial companies from municipal fees and fees for leasing government industrial lands for 3 months, as well as redirecting the programs of the "Tamkeen" Labor Fund to support the affected companies, in addition to the restructuring of the loans granted. Postponement of the payment of the social security contribution for the second quarter of the year for 3 months, postponement of the payment of bank debt installments for 6 months and rescheduling of tax and customs debts for 7 years. Exemption of industrial facilities against which customs decisions have been issued from the payment of 10% of the value of the duty amounts.
The formation of a technical committee and the development of an action plan to face the repercussions of the pandemic.
Sources: national sources; the Organization of Arab Petroleum Exporting Countries (OAPEC); The Arab Organization for Industrial Development and Mining, Industrial Statistics for the Arab States; The Arab Fertilizers Association, Annual Statistical Report, 2021 US Geological Survey data. Appendix Table (4/5): Reserves and production of some extractive industries (2020) in the Arab countries that market natural gas. Appendix Table (4/4): Share of Value Added Industrial Workers in the Industrial Sector and Industrial Economic Efficiency in Arab Countries.
Source: Arab Organization for Agricultural Development (AOAD), report on the performance of the agricultural sector in the Arab countries 2021.
Annex Table (3/11): Food Gap of Basic Food Commodities (2010, 2016-2019) Self Sufficiency Ratios (%) 20102018Percentage Change (%)201920162017
Con'td Annex Table (3/9): Imports of Basic Food Commodities of Arab Countries Average Annual Change (%) (2010-2019)
Continued appendix table (3/8): Net agricultural imports and net agricultural imports per per capita in Arab countries' net agricultural imports (millions of US dollars). Appendix table (3/8): Agricultural exports and imports of the Arab countries Average annual change (%) Agricultural exports Average annual change (%) Agricultural imports. Appendix table (3/7): Agricultural production at constant prices and its share per per capita in the Arab countries Agricultural production (millions of US dollars) per capita Share of agricultural production (US dollars) Contribution of agriculture to GDP.
Annex Table (3/6): Fish Production in the Arab Countries (2010, 2016-2020)
Source: Arab Organization for Agricultural Development (AOAD), report on the performance of the agricultural sector in the Arab countries 2021. 2) Agricultural production share of GDP / Agricultural labor force share of Total Labor Force. Sources: Food and Agriculture Organization of the United Nations (FAO) Database 2021, International Labor Organization (ILO), Database 2021. 2) Agricultural Production Share of GDP / Agricultural Labor Force Share of Total Labor Force. Sources: Food and Agriculture Organization of the United Nations (FAO) Database 2021, International Labor Organization (ILO), Database 2021.
Sources: Food and Agriculture Organization of the United Nations (FAO) Database 2021, International Labor Organization (ILO), Database 2021.
Cont'd Annex Table (3/2): The Labor Force in Agriculture in the Arab Countries (2010, 2016-2019)
Appendix table (3/2): Agricultural population and agricultural population in Arab countries Agricultural population (thousands) Agricultural population (thousands). Annex table (2/18): Selective unemployment indicators in the Arab countries (1) The unemployment rate among nationals was estimated at 6.9% and the number of unemployed was about 35,000. Source: Table of Annexes (3/3), Joint Arab Economic Report, various reports; National Sources; The World Bank's "World Development Indicators Food and Agriculture Organization of the United Nations (FAO) Database 2021; UNICEF, the World's Children Situation 2019; International Labor Organization (ILO) Database 2021. Ages 15+ )to Total Employment (%)ServicesAgricultureIndustry.
The following table (2/17): Employment of Arab countries by main economic sectors (%) Employment as a percentage of the total population Percentage of employed women (age 15+).
Cont'd Annex Table (2/16) : Illiteracy Rate in the Arab Countries (B) : Guide to Gender Equality in Illiteracy rate * Youth (People Ages 15-24)Adult (People Ages 15 and Above)Guide to Gender Equality in Illiteracy Rate
Source: National sources; UNESCO, Database 2021; World Bank, "World Development Indicators" and World Bank Database 2021. Sources: National sources; UNESCO, Database, January 2021; UNDP, Human Development Report, 2021; UNICEF, State of the World's Children 2019.
Annex Table (2/14) : Expected Years of Schooling and Dropout Rates in Primary Education Dropout Rate (%)Expected Years of Schooling 2019
Source: National sources; World Bank, "World Development Indicators", various reports; World Bank Database 2021; World Health Organization (WHO) database 2021; United Nations Children's Fund (UNICEF), State of the World's Children 2019. Life expectancy at birth World Health Organization (WHO) database, 2021; United Nations Children's Fund (UNICEF), State of the World's Children 2019. Children under five Mortality Infant mortality (births per woman) (per 100,000 live births) Crude birth rate Total fertility rate Crude death rate Maternal mortality Source; World Bank, "World Development Indicators", various reports and World Bank Database 2021; UNDP, "Human Development Report" 2020;.
Source: National sources; World Bank, "World Development Indicators" and Database 2021; World Health Organization (WHO) database, 2021;.
Annex Table (2/9) : Land Area, Population Density, Urban and Rural Population of Arab Countries Population Density (People/km2 of Land Area) 2010201920102019
National poverty line: 1277 Tunisian dinars/year per person for urban areas and 820 Tunisian dinars/year per National Poverty Line: 4395 Moroccan Dirhams for urban areas and 4266 Moroccan Dirhams for rural areas (year . 2014). Annex table (2/4): Gross domestic product by economic activity (at current market prices) HousingPublic services Other services.
Appendix Table (2/3): Gross Domestic Product by economic activity (at current market prices) Indirect market Goods production sectors Production services sectors Factor Mining and quarrying Manufacturing industries. 2020) Sectors of Social Services Housing Public Services Other Services ةلودلعاطقلا.
Other Emerging Market Economies (2016-2020)
Annex Table (1/5): International Trade Volumes Growth Rate and Terms of Trade (2016-2020)
Annex Table (1/3): Unemployment and Employment Growth in Developed Countries (2016-2020)
Annex Table (1/2): World Average Inflation Rates * (2016-2020)
The Latin American and Caribbean group was formerly called the Western Hemisphere, it includes countries in North America (excluding the USA and Canada), South America and the Caribbean. The Latin American and Caribbean group was formerly called the Western Hemisphere, it includes countries in North America (excluding the USA and Canada), South America and the Caribbean.
Annex Tables
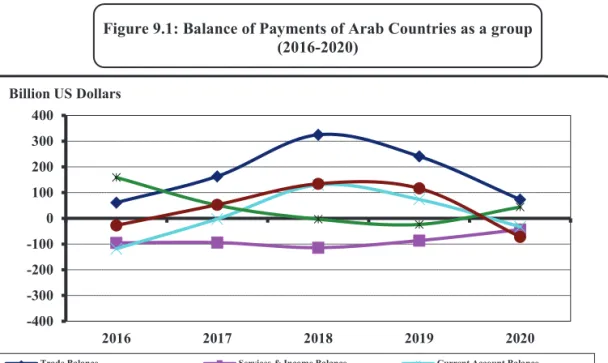
The value of service payments of Arab countries fell by 26.8 percent to reach $240.7 billion in 2020. Public finances in Arab countries were greatly affected by the consequences of the COVID-19 Pandemic in 2020. Thus, the decline in total Production of industrial sector in Arab countries in 2020 reached 28.9 percent.
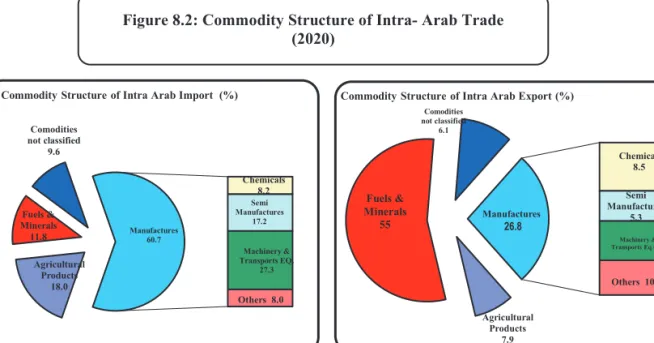
The decrease in global demand for various raw materials, especially oil, had a negative impact on Arab countries' exports in 2020.