Directory UMM :Data Elmu:jurnal:B:Biosystems:Vol59.Issue1.2001:
Teks penuh
Gambar
Dokumen terkait
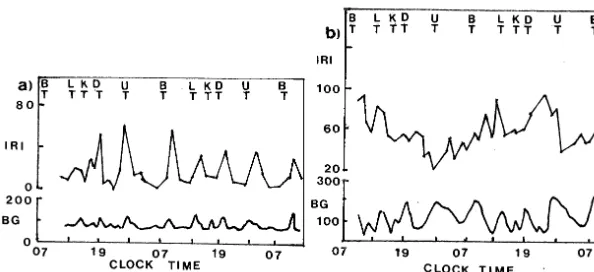
Blood glucose and NEFA were not affected by bromocryptine in period I but in period II an increase in blood glucose with a simultaneous decrease in NEFA was observed ( P <
In the present study, the higher the storage temperature and the longer the duration of storage, the lower the initial increase in fresh weight and the greater the decrease in
Stimulatory and inhibitory effects of opioid in the was enough to induce drastic fluorescence ratio increase in same cell 50% of the acutely dissociated cells (n 5 120), as a typical
In the caudate, two-factor ANOVA indicates no age-dependent difference for the increase of dopamine turnover after MDMA (no interaction of treatment 3 age) but the decrease in
Task Number of % with Activation All the tasks produced functional activation in the basal studies basal ganglia Size ganglia, motor cortex, and supplementary motor area (right / left
Before the introduction of insulin therapy, the NIDDM patients, compared to normolipidaemic healthy control subjects, presented a significantly re- duced HDL cholesterol level, a
A comparison between the minimal model and the glucose clamp in the assessment of insulin sensitivity across the spectrum of glucose tolerance: Insulin Resistance Atheroscle-
The cumulative ef- fect of N deprivation through the season as crop mass increased apparently resulted in the relatively greater decrease in leaf N concentration under the low soil
