isprsarchives XXXIX B7 505 2012
Teks penuh
Gambar
Dokumen terkait
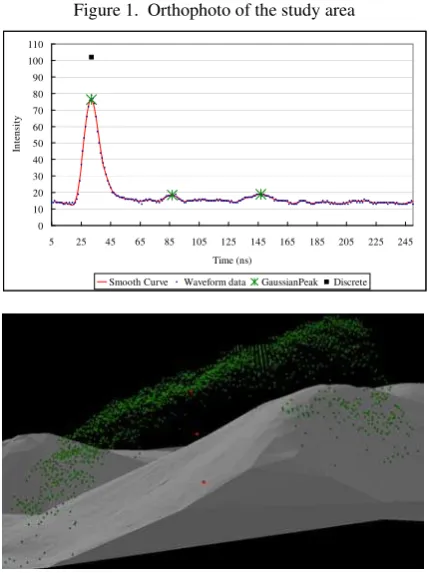
The wavelet-based detector can detect both of the echoes even the relative intensity ratio reach 4 if the distance between two echoes is greater than the range resolution of a
1) Decompose the image into L scales by the block averaging algorithm. 2) Use the OTSU algorithm to initialize the level set function of scale L. 3) Obtain the
Thereby, the research uses the remote sensing to identify, to analyse and to measure the urban sprawl in the selected megacities, using the LandSat7 imagery,
As the first data-merged models built in SS-3 were applied to a larger area in SS-4 including Tong-Mao Mountain, with 10 km away from the three sites at Huisun, the kappa
To evaluate the wetland-related types of data accurately for both the Global Land Cover 2000 (GLC2000) data set and MODIS land cover data set (MOD12Q1), we used the China wetland
Other auxiliary image data (bands) are created to be used in the classification process. The auxiliary bands are: the texture from the intensity data, and the
The aim of this work is the comparative study of the presence of hydrothermal alteration materials in the Turrialba volcano (Costa Rica) in relation with computed spectral
The combination of DTMs derived from LROC NAC images and height data of the LOLA (Lunar Orbiter Laser Altimeter) instrument (Smith et al. 2010) allows for an automatic
