FUNDAMENTALS OF PROBABILITY AND STATISTICS FOR ENGINEERS
Teks penuh
Gambar

Dokumen terkait
distribution of the random variables. Analogous to the probability density function of a single continuous random variable, a joint probability density function can be dei ned
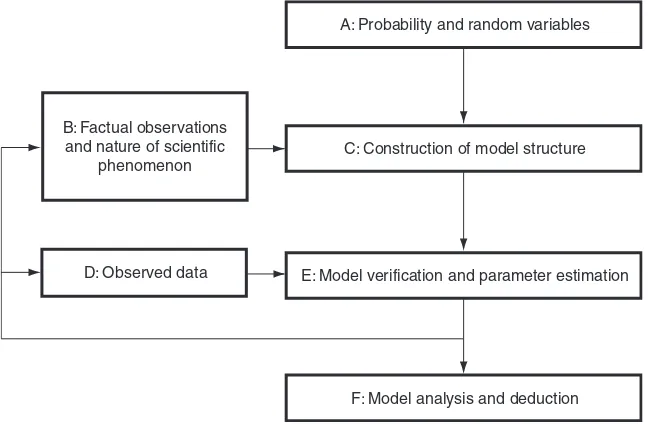
One can glean from the two examples above that the sample information is made available to the analyst and, with the aid of statistical methods and elements of probability,
In the case of tossing a coin three times, the variable X, representing the number of heads, assumes the value 2 with probability 3/8, since 3 of the 8 equally likely sample
Probabilities associated with binomial experiments are readily obtainable from the formula b ( x ; n, p ) of the binomial distribution or from Table A.1 when n is small. In
The point and interval estimations of the mean in Sections 9.4 and 9.5 provide good information about the unknown parameter µ of a normal distribution or a nonnormal distribution
For example, if the test is two tailed and α is set at the 0.05 level of significance and the test statistic involves, say, the standard normal distribution, then a z-value is
In such a case, if X is the random variable denoting the number of blue marbles chosen (successes) in n trials, then using the binomial distribution (1) we see that the probability
In an industrial example, when a sample of items selected from a batch of production is tested, the number of defective items in the sample usually can be modeled as a hypergeometric
