Dang Maulida +62-21-515-1140 [email protected] To subscribe to our Daily Focus, please contact us at [email protected]
Mirae Asset Sekuritas Indonesia
Indonesia excels, in terms of growth
Source: Tourism Ministry, Mirae Asset Sekuritas Indonesia Research
March 10, 2017
Hope on tourism
Contribution from the tourism sector
Meskipun jumlah Indonesia wisman tertinggal tetangganya, kontribusi ekonomi dari sektor pariwisata tidak dapat berada di bawah-diperkirakan. Kontribusi dari sektor pariwisata terhadap total perekonomian sebesar IDR296,9tr pada tahun 2011 atau yang mewakili 4,0% terhadap total Produk Domestik Bruto (PDB), dan meningkat menjadi IDR461,4tr pada tahun 2015 mewakili 4,23% terhadap PDB. Pada 2015, bagaimanapun, devisa dari sektor pariwisata sebesar USD9.7bn yang mewakili kontribusi tertinggi keempat dibandingkan dengan yang dari minyak & gas (USD15.8bn), batubara (USD13.6bn), dan CPO (USD12.9bn) .
Bali attracts the the most
Sejak 2011, kementerian pariwisata Indonesia mengadopsi Organisasi Manajemen Tujuan (DMO) pendekatan tujuan untuk secara optimal mengontrol dan mengelola tujuan wisata favorit di negara itu. Terutama DMO Sanur (Bali) yang menarik 4juta wisatawan asing pada 2015 dibandingkan dengan 5juta jumlah wisatawan asing di 16 cluster pada tahun 2015, dan dibandingkan dengan populasi dari 4.2juta orang (2014). Memang, Bali adalah tujuan wisata yang populer, yang telah melihat peningkatan yang signifikan dalam wisatawan sejak tahun 1980-an. Terutama pekan ini dilaporkan bahwa Raja Salman dari Arab Saudi dan rombongan dari 1,500 delegasi memperpanjang tinggal di Bali dari jadwal semula 4-9 Maret sampai 12 Maret. Ini tanda-tanda bahwa keseluruhan upaya pemerintah untuk mempromosikan Indonesia, terutama dari sektor pariwisata telah menunjukkan hasil yang harus diberi tepuk tangan.
Consumer sector in Bali economy
Jasa akomodasi dan Makanan & Minuman adalah kontributor tertinggi dalam perekonomian di provinsi Bali, di 22,8% pada tahun 2016, diikuti oleh yang dari pertanian, kehutanan dan perikanan pada 14,7%. Rata-rata tinggal wisatawan asing di Bali adalah tiga hari dengan tingkat hunian hotel (1 - 5 hotel bintang) mencapai 60% pada tahun 2016 yang memicu efek multiplier dalam perekonomian. Upaya kesinambungan untuk memperkuat dan mempromosikan pariwisata di Bali maupun di DMOS lainnya akan memperkuat perekonomian negara.
Market Index
Last Trade Chg (%) MoM YoY
JCI 5,402.4 0.2 0.4 12.5
MSCI Indonesia 24.5 0.1 -2.2 5.4
MSCI EM 922.9 -1.3 1.0 18.7
HANG SENG 23,501.6 -1.2 0.9 19.0
KOSPI 2,091.1 -0.1 0.8 6.2
FTSE 7,315.0 -0.3 1.0 21.5
DJIA 20,858.2 0.0 2.9 22.7
NASDAQ 5,838.8 0.0 1.8 25.2
Valuation
2017F P/E (x) P/B (x) ROE (%)
JCI 15.6 2.3 18.1
Key Rates
Last Trade Chg (bps) MoM YoY
BI 7-Day RR 4.75 0 0 -50*
3yr 7.10 0 0 -50
10yr 7.50 8 -2 -38
*since introduced in Aug 2016
FX
Last Trade Chg (%) MoM YoY
USD/IDR 13,390.00 0.3 0.4 1.5
USD/KRW 1,157.88 1.1 0.6 -3.8
USD/JPY 114.95 0.5 1.5 1.6
USD/CNY 6.91 0.2 0.6 6.1
Commodities
Last Trade Chg (%) MoM YoY
WTI 49.3 -2.0 -9.3 11.4
Gold 1,201.2 -0.6 -2.6 -5.6
Coal 78.2 -4.9 -1.9 52.4
Palm Oil 705.0 0.0 5.0 21.3
Rubber 186.7 0.0 -13.7 68.4
Nickel 10,200.0 -4.2 -0.8 14.7
Copper 5,765.5 -0.1 -1.0 16.8
Tin 19,275.0 -0.5 1.6 15.3
JCI Index VS MSCI Emerging Markets
650 800 950 1,100
3,500 4,500 5,500
03/13 03/14 03/15 03/16 03/17
(pt) JCI MSCI EM (pt)
800 950 1,100
4,500 5,500
(pt) JCI MSCI EM (pt)
2
Mirae Asset Sekuritas Indonesia cartoon
Local flashes
WIKA: Realisasi kontrak baru Wijaya Karya capai 30,8%. Perusahaan pelat merah PT Wijaya Karya Tbk (WIKA) mencatatkan perolehan kontrak baru sebesar Rp 13,32 triliun hingga awal Maret 2017. Pencapaian ini sekitar 30,8% dari target kontrak baru sepanjang 2017 yang mencapai Rp 43,2 triliun. Pencapaian tersebut didukung dengan berhasilnya WIKA memenangkan proyek jalan Tol Cengkareng-Batu Ceper-Kunciran senilai Rp 2,1 triliun. Selain itu, beberapa kontrak baru juga dicatatkan perusahaan, seperti pembangunan integrated tank storage terminal, Transpark Cibubur, dan juga PLTU 1X1.000 MW di Cilacap. (Kontan)
ANJT: Austindo Nusantara balikkan kinerja, sukses raup laba. PT Austindo Nusantara Jaya Tbk. (ANJT), yang bergerak di sektor perkebunan terutama sawit, akhirnya pada tahun lalu berhasil menangguk laba. ANJT membalik kinerja pada 2015 dengan hasil positif hingga Desember tahun lalu. Perusahaan menilai kontribusi kenaikan harga jual rata-rata minyak kelapa sawit mendongkrak kinerja tahun lalu. Pada 2016, pendapatan ANJT meningkat menjadi US$134,4 juta, naik 6,7% dari US$126,0 juta periode 2015.
Tak hanya itu, perusahaan menyimpulkan positifnya kinerja tahun lalu berkat keberhasilan membatasi turunnya produksi akibat dampak buruk dari El Nino. (Bisnis Indonesia)
BBRI: BRI belanjakan Rp75 miliar bangun cabang digital. PT Bank Rakyat Indonesia Persero Tbk menargetkan membangun 25 gerai (outlet) digital tahun 2017 dengan biaya investasi Rp1 miliar-Rp3 miliar untuk setiap gerai. Direktur Utama BRI Asmawi Syam di Jakarta, mengatakan saat ini perseroan sudah mempunyai 12 gerai BRI digital.
Gerai tersebut menjadi amunisi BRI untuk menggaet pasar nasabah generasi milenia, atau generasi yang dalam kegiatan sehari-harinya sangat mengandalkan gawai dan teknologi. (Iqplus)
KKGI: Resources Alam keluarkan US$1,36 juta biaya eksplorasi hingga Februari. PT Resources Alam Indonesia Tbk (KKGI) mengeluarkan biaya eksplorasi sebesar US$1.366.444 sampai bulan Februari 2017, demikian disampaikan Lenny. SC, Corporate Secretary KKGI. Menurut aktivitas eksplorasi dilakukan oleh anak usaha perseroan yakni PT Insani Baraperkasa dimana kegiatan eksplorasi pengembangan dilakukan di area Sub Blok Handil Bakti. (Iqplus)
LPCK: Lippo Cikarang anggarkan capex Rp 250 miliar di 2017. PT Lippo Cikarang Tbk (LPCK) menganggarkan belanja modal ataucapital expenditure (capex) Rp250 miliar tahun ini. Anggaran itu salah satunya akan digunakan untuk melanjutkan pengembangan kawasan multifungsi atau mixed use Orange County di Jakarta Timur.
Proyek itu dikembangkan di atas lahan seluas 322 hektare (ha) dengan nilai proyek Rp 250 triliun. (Kontan)
INCO: Vale Indonesia habiskan dana US$591.885 untuk eksplorasi Februari. PT Vale Indonesia Tbk (INCO) menghabiskan dana sebesar US$591.885 untuk kegiatan eksplorasi bulan Februari 2017. Menurut keterangan perseroan Kamis disebutkan bahwa daerah eksplorasi berada di Blok Soroako di kabupaten Luwu Timur Sulawesi Selatan dan Blok Bahodopi di Kabupaten Morowali, Sulawesi Tengah. (Iqplus)
WIIM: Wismilak perkuat segmen strong mild dan kretek. Perusahaan rokok PT Wismilak Inti Makmur Tbk memperkuat segmen strong mild dan kretek. Perusahaan ini meluncurkan dua produk anyar, yakni Diplomat Impact di segmen strong mild, dan Wismilak Dirgha di segmen kretek premium. “Kedua produk baru kami didisain untuk perokok di segmen strong mild dan segmen kretek,” kata Doni Arya, Marketing Manager PT Wismilak Inti Makmur Tbk. Produk Diplomat Impact menyasar pasar anak muda. (Kontan)
4
Technical analysis
Tasrul +62-21-515-1140 [email protected] Jakarta Composite Index (JCI) – Consolidation
IHSG akan coba naik mendekati center line pada uptrend channel
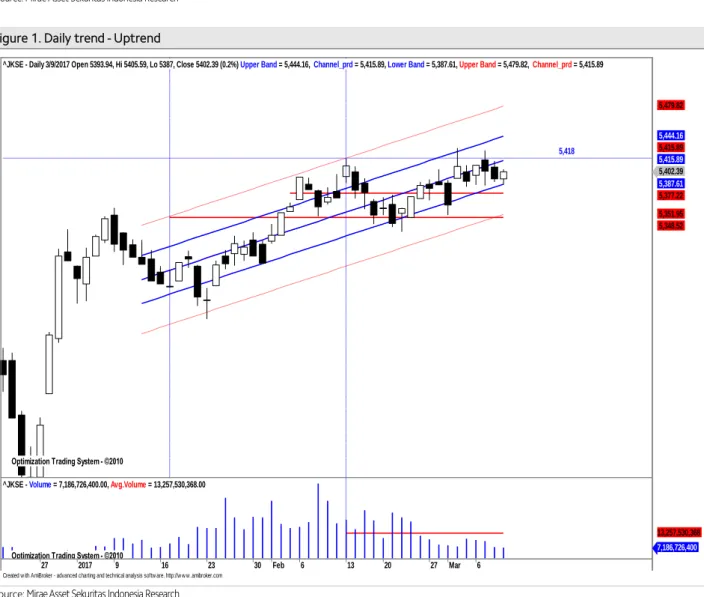
IHSG saat masih dalam pola uptrend jangka pendek relatif valid yang dimulai sejak selama 40 hari terakhir dengan r-squared = 0.7615 dan bergerak normal dalam rentang +/-1.18 std.deviasi dari centerline. Peluang IHSG bergerak di luar pergerakan normal sekitar 23.85% atau sekitar 10 bar chart. Volatilitas normal pergerakan IHSG saat ini sebesar +/-0.38% atau sekitar +/- 20.7 point. IHSG akan coba menguji resistance di 5,418 sebagaimana terlihat pada Figure 1.
Summary
Item Data Item Data
Close (March 9, 2017) 5,402.4 (+0.2%) Trading range 5,378-5,418 Average index performance (%) 1.05 Target
Period 40 - Daily 5,418
r-squared 0.7615 - Weekly 5,437
Volatility (+/-, %) 0.38 - Monthly 5,472 Volatility (+/-, point) 20.7 Stop loss 5,378 Source: Mirae Asset Sekuritas Indonesia Research
Figure 1. Daily trend - Uptrend
Source: Mirae Asset Sekuritas Indonesia Research
Created w ith AmiBroker - advanced charting and technical analysis softw are. http://w w w .amibroker.com Optimization Trading System - ©2010
Optimization Trading System - ©2010 Optimization Trading System - ©2010 Optimization Trading System - ©2010
5,418
^JKSE - Daily 3/9/2017 Open 5393.94, Hi 5405.59, Lo 5387, Close 5402.39 (0.2%) Upper Band = 5,444.16, Channel_prd = 5,415.89, Lower Band = 5,387.61, Upper Band = 5,479.82, Channel_prd = 5,415.89
5,402.39 5,387.61 5,377.22 5,351.95 5,348.52 5,415.89 5,415.89 5,444.16 5,479.82
27 2017 9 16 23 30 Feb 6 13 20 27 Mar 6
Optimization Trading System - ©2010
^JKSE - Volume = 7,186,726,400.00, Avg.Volume = 13,257,530,368.00
7,186,726,400 13,257,530,368
Aliran dana keluar cenderung tertahan masih terlihat dan volatilitas indeks naik masih terlihat.
Pada Figure 2, terlihat dari hasil optimalisasi terakhir, indikator MFI Optimized akan menguji support trendline dan indikator RSI optimized masih cenderung naik dengan volume sekitar rata-rata, dengan demikian potensi kenaikkan masih terlihat namun terbatas . Resistance terdekat di 5,418 dan support di 5,378 yang sekaligus sebagai stop loss level.
Figure 2. Daily MFI optimized & RSI optimized
Source: Mirae Asset Sekuritas Indonesia Research
Created w ith AmiBroker - advanced charting and technical analysis softw are. http://w w w .amibroker.com
^JKSE - MFI Smoothed = 49.93
49.933
^JKSE - RSI Smoothed = 54.05
54.0549
Optimization Trading System - ©2010 Optimization Trading System - ©2010 Optimization Trading System - ©2010
5,418
^JKSE - Daily 3/9/2017 Open 5393.94, Hi 5405.59, Lo 5387, Close 5402.39 (0.2%) VWAP = 5,336.80, VWAP = 5,378.42, VWAP = 5,348.52
5,402.39 5,378.42 5,348.52 5,336.8
10 17 24 31Nov 7 14 21 28 Dec 13 19 27 2017 9 16 23 30 Feb 6 13 20 27 Mar 6
Optimization Trading System - ©2010
^JKSE - Volume = 7,186,726,400.00, Avg.Volume = 13,257,530,368.00
7,186,726,400 13,257,530,368
6 IHSG akan coba naik mendekati resistance 2 pada masing-masing periode.
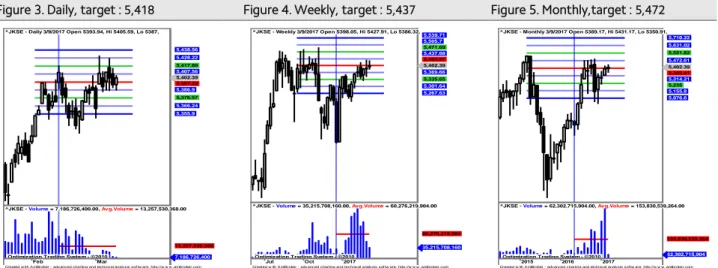
Untuk mampu naik lebih lanjut IHSG saat ini harus mampu bertahan minimal sekitar rata-rata masing-masing periode dengan target terdekat berikutnya resistance 2 pada periode masing-masing sebagaimana terlihat pada Figure 3,4 dan 5.
Figure 3. Daily, target : 5,418 Figure 4. Weekly, target : 5,437 Figure 5. Monthly,target : 5,472
x
Source: Mirae Asset Sekuritas Indonesia Research Source: Mirae Asset Sekuritas Indonesia Research Source: Mirae Asset Sekuritas Indonesia Research
Created w ith AmiBroker - advanced charting and technical analysis sof tw are. http://w w w .amibroker.com
^JKSE - Daily 3/9/2017 Open 5393.94, Hi 5405.59, Lo 5387,
5,402.39 5,397.23 5,386.9 5,376.57 5,366.24 5,355.9 5,407.56 5,417.89 5,428.22 5,438.56
Feb Mar
Optimization Trading System - ©2010
^JKSE - Volume = 7,186,726,400.00, Avg.Volume = 13,257,530,368.00
7,186,726,400 13,257,530,368
Created w ith AmiBroker - advanced charting and technical analysis sof tw are. http://w w w .amibroker.com
^JKSE - Weekly 3/9/2017 Open 5398.05, Hi 5427.91, Lo 5386.32,
5,402.39 5,369.66 5,335.65 5,301.64 5,267.63 5,403.67 5,437.68 5,471.69 5,505.7 5,539.71
Jul Oct 2017
Optimization Trading System - ©2010
^JKSE - Volume = 35,215,708,160.00, Avg.Volume = 60,276,219,904.00
35,215,708,160 60,276,219,904
Created w ith AmiBroker - advanced charting and technical analysis sof tw are. http://w w w .amibroker.com
^JKSE - Monthly 3/9/2017 Open 5389.17, Hi 5431.17, Lo 5350.91,
5,402.39 5,393.41 5,314.21 5,235 5,155.8 5,076.6 5,472.61 5,551.82 5,631.02 5,710.22
2015 2016 2017
Optimization Trading System - ©2010
^JKSE - Volume = 62,302,715,904.00, Avg.Volume = 153,830,539,264.00
62,302,715,904 153,830,539,264
Stocks on our focus list
XL Axiata (EXCL) – Trading Buy
Harga akan coba naik dan tembus normal lower band pada trend channel.
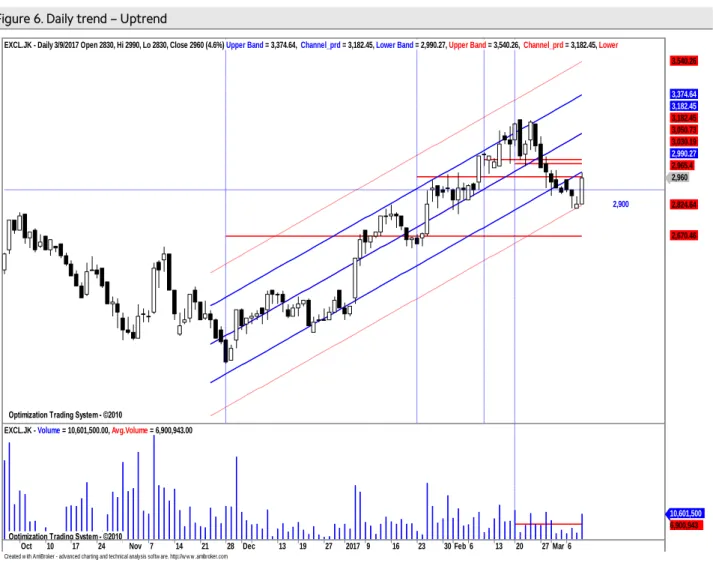
Secara umum harga saham ini masih bergerak pada uptrend channel yang masih relatif valid (r-squared = 0.84) selama 73 hari terakhir yang bergerak normal dalam rentang +/- 1.4 std.deviasi dari center line. Peluang harga keluar dari pergerakan normal sekitar 16.15 % (sekitar 11 bar chart ). Volatilitas normal pergerakkan harga saham ini sepanjang uptrend channel sebesar +/- 2.22% atau sekitar +/-65.76 (potensi naik dan turun secara normal maksimum/minimum sebesar 65 rupiah) dari level penutupan terakhir. Saat ini harga akan coba naik dan tembus normal lower band pada uptrend channel sebagaimana terlihat pada Figure 6.
Summary
Item Data Item Data
Close (March 9, 2017) 2,960(+4.6%) Trading range 2,900-3,050
Relative Avg. Price performance to JCI (%) 1.14 Target
β (beta) 0.16 - Daily 3,000
Corelation 0.64 - Weekly 3,040
Period 73 - Monthly 3,150
r-squared 0.84 Stop loss 2,810
Volatility (+/-, %) 2.22
Volatility (+/-, Rp.) 65.76
Source: Mirae Asset Sekuritas Indonesia Research
Figure 6. Daily trend – Uptrend
Source: Mirae Asset Sekuritas Indonesia Research
Created w ith AmiBroker - advanced charting and technical analysis softw are. http://w w w .amibroker.com Optimization Trading System - ©2010
Optimization Trading System - ©2010 Optimization Trading System - ©2010 Optimization Trading System - ©2010 Optimization Trading System - ©2010 Optimization Trading System - ©2010
2,900 EXCL.JK - Daily 3/9/2017 Open 2830, Hi 2990, Lo 2830, Close 2960 (4.6%) Upper Band = 3,374.64, Channel_prd = 3,182.45, Lower Band = 2,990.27, Upper Band = 3,540.26, Channel_prd = 3,182.45, Lower
2,960
2,824.64
2,670.46 2,965.4 2,990.27 3,030.19 3,050.73 3,182.45 3,182.45 3,374.64 3,540.26
Oct 10 17 24 31Nov 7 14 21 28 Dec 13 19 27 2017 9 16 23 30 Feb 6 13 20 27 Mar 6
Optimization Trading System - ©2010
EXCL.JK - Volume = 10,601,500.00, Avg.Volume = 6,900,943.00
10,601,500 6,900,943
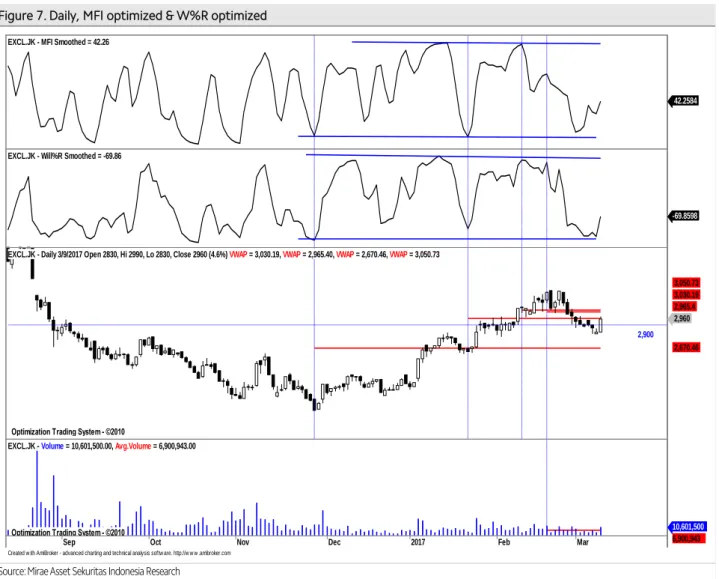
8 Aliran dana masuk dan volatilitas harga naik masih terlihat.
Pada Figure 7, terlihat dari hasil optimalisasi terakhir, indikator MFI Optimized dan indikator W%R optimized cenderung naik dengan volume tembus rata-rata. Hal ini mengindikasikan potensi kenaikkan masih terlihat. Resistance terdekat di 3,050.
Support terdekat di 2,900 dan stop loss level di 2,810.
Figure 7. Daily, MFI optimized & W%R optimized
Source: Mirae Asset Sekuritas Indonesia Research
Created w ith AmiBroker - advanced charting and technical analysis softw are. http://w w w .amibroker.com EXCL.JK - MFI Smoothed = 42.26
42.2584
EXCL.JK - Will%R Smoothed = -69.86
-69.8598
Optimization Trading System - ©2010 Optimization Trading System - ©2010 Optimization Trading System - ©2010 Optimization Trading System - ©2010
2,900 EXCL.JK - Daily 3/9/2017 Open 2830, Hi 2990, Lo 2830, Close 2960 (4.6%) VWAP = 3,030.19, VWAP = 2,965.40, VWAP = 2,670.46, VWAP = 3,050.73
2,960
2,670.46 2,965.4 3,030.19 3,050.73
Sep Oct Nov Dec 2017 Feb Mar
Optimization Trading System - ©2010
EXCL.JK - Volume = 10,601,500.00, Avg.Volume = 6,900,943.00
10,601,500 6,900,943
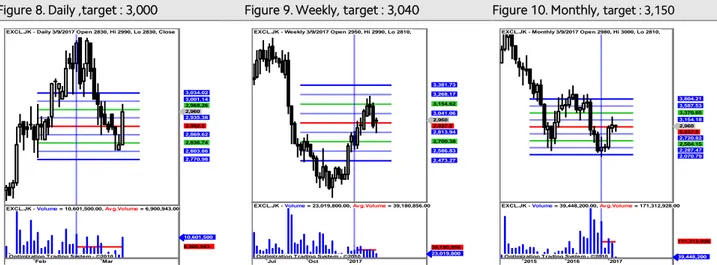
Harga akan coba naik tembus resistance 2 pada periode daily dan bertahan diatas rata-rata pada periode weekly dan monthly.
Untuk naik lebih lanjut harga harus mampu bertahan minimal sekitar rata-rata masing- masing periode dengan target kenaikkan ke resistance 2 pada masing-masing periode sebagaimana terlihat pada Figure 8,9 dan 10.
Figure 8. Daily ,target : 3,000 Figure 9. Weekly, target : 3,040 Figure 10. Monthly, target : 3,150
Source: Mirae Asset Sekuritas Indonesia Research Source: Mirae Asset Sekuritas Indonesia Research Source: Mirae Asset Sekuritas Indonesia Research
Created w ith AmiBroker - advanced charting and technical analysis sof tw are. http://w w w .amibroker.com EXCL.JK - Daily 3/9/2017 Open 2830, Hi 2990, Lo 2830, Close
2,960 2,935.38 2,902.5 2,869.62 2,836.74 2,803.86 2,770.98 2,968.26 3,001.14 3,034.02
Feb Mar
Optimization Trading System - ©2010
EXCL.JK - Volume = 10,601,500.00, Avg.Volume = 6,900,943.00
10,601,500 6,900,943
Created w ith AmiBroker - advanced charting and technical analysis sof tw are. http://w w w .amibroker.com EXCL.JK - Weekly 3/9/2017 Open 2950, Hi 2990, Lo 2810,
2,960 2,927.5 2,813.94 2,700.38 2,586.83 2,473.27 3,041.06 3,154.62 3,268.17 3,381.73
Jul Oct 2017
Optimization Trading System - ©2010
EXCL.JK - Volume = 23,019,800.00, Avg.Volume = 39,180,856.00
23,019,800 39,180,856
Created w ith AmiBroker - advanced charting and technical analysis sof tw are. http://w w w .amibroker.com EXCL.JK - Monthly 3/9/2017 Open 2980, Hi 3000, Lo 2810,
2,960 2,937.5 2,720.82 2,504.15 2,287.47 2,070.79 3,154.18 3,370.85 3,587.53 3,804.21
2015 2016 2017
Optimization Trading System - ©2010
EXCL.JK - Volume = 39,448,200.00, Avg.Volume = 171,312,928.00
39,448,200 171,312,928
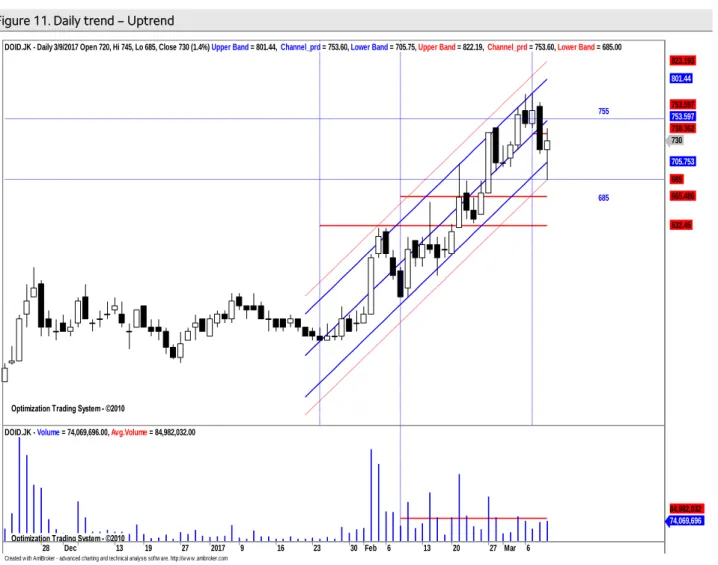
10 Delta Dunia Makmur (DOID) – Buy on Weakness
Harga akan coba bertahan diatas abnormal lower band pada uptrend channel . Secara umum harga saham ini juga masih bergerak dalam pola uptrend channel jangka pendek yang masih relatif valid (r-squared = 0.92) selama 34 hari terakhir dan bergerak normal dalam rentang +/- 1.89 std.deviasi dari center line. Peluang harga keluar dari pergerakan normal sekitar 8.48 % (sekitar 3 bar chart ). Volatilitas normal pergerakan harga saham ini sepanjang uptrend channel sebesar +/ 3.02 % atau sekitar +/- 22.05 (potensi naik dan turun secara normal maksimum/minimum sebesar 20 rupiah) dari level penutupan terakhir. Saat ini harga akan coba bertahan diatas abnormal lower band pada uptrend channel sebagaimana terlihat pada Figure 11.
Summary
Item Data Item Data
Close (March 9, 2017) 730(+1.4%) Trading range 685-755 Relative Avg. Price performance to JCI (%) 16.27 Target
β (beta) 1.88 - Daily 740
Corelation 0.83 - Weekly 760
Period 34 - Monthly 800
r-squared 0.92 Stop loss 665
Volatility (+/-, %) 3.02
Volatility (+/-, Rp.) 22.05
Source: Mirae Asset Sekuritas Indonesia Research
Figure 11. Daily trend – Uptrend
Source: Mirae Asset Sekuritas Indonesia Research
Created w ith AmiBroker - advanced charting and technical analysis softw are. http://w w w .amibroker.com Optimization Trading System - ©2010
Optimization Trading System - ©2010 Optimization Trading System - ©2010 Optimization Trading System - ©2010 Optimization Trading System - ©2010
755
685 DOID.JK - Daily 3/9/2017 Open 720, Hi 745, Lo 685, Close 730 (1.4%) Upper Band = 801.44, Channel_prd = 753.60, Lower Band = 705.75, Upper Band = 822.19, Channel_prd = 753.60, Lower Band = 685.00
730
705.753
685 665.486
632.45 738.362 753.597 753.597 801.44 822.193
28 Dec 13 19 27 2017 9 16 23 30 Feb 6 13 20 27 Mar 6
Optimization Trading System - ©2010
DOID.JK - Volume = 74,069,696.00, Avg.Volume = 84,982,032.00
74,069,696 84,982,032
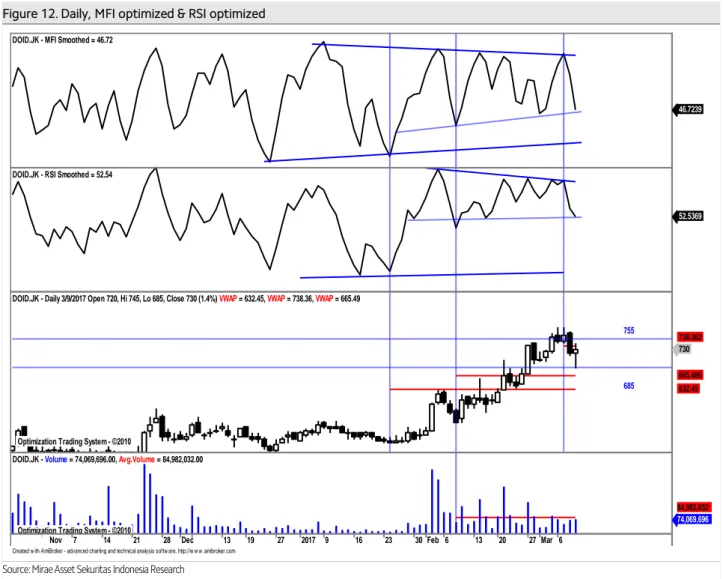
Aliran dana kelur dan volatilitas harga turun masih terlihat.
Pada Figure 12, terlihat dari hasil optimalisasi indikator MFI Optimized dan indikator RSI Optimized masih cenderung turun dengan volume sekitar rata-rata. Hal ini mengindikasikan potensi koreksi masih terlihat. Resistance berikutnya di 755. Support saat ini di 685. Stop loss level di 665.
Figure 12. Daily, MFI optimized & RSI optimized
Source: Mirae Asset Sekuritas Indonesia Research
Created w ith AmiBroker - advanced charting and technical analysis softw are. http://w w w .amibroker.com DOID.JK - MFI Smoothed = 46.72
46.7239
DOID.JK - RSI Smoothed = 52.54
52.5369
Optimization Trading System - ©2010 Optimization Trading System - ©2010 Optimization Trading System - ©2010
755
685 DOID.JK - Daily 3/9/2017 Open 720, Hi 745, Lo 685, Close 730 (1.4%) VWAP = 632.45, VWAP = 738.36, VWAP = 665.49
730
665.486 632.45 738.362
31Nov 7 14 21 28 Dec 13 19 27 2017 9 16 23 30 Feb 6 13 20 27 Mar 6
Optimization Trading System - ©2010
DOID.JK - Volume = 74,069,696.00, Avg.Volume = 84,982,032.00
74,069,696 84,982,032
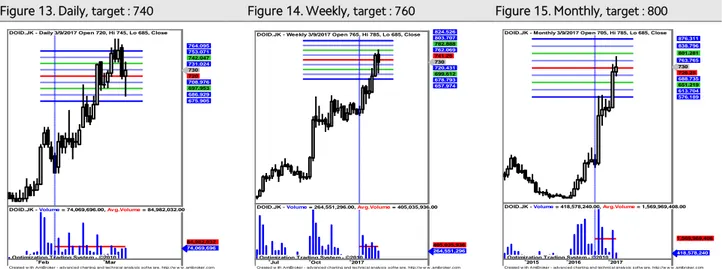
12 Harga akan coba bertahan minimal sekitar rata-rata pada masing-masing periode.
Untuk naik lebih lanjut harga harus mampu bertahan sekitar rata-rata masing-masing periode dengan target berikutnya tembus resistance 2 sebagaimana terlihat pada Figure 14,15 dan 16.
Figure 13. Daily, target : 740 Figure 14. Weekly, target : 760 Figure 15. Monthly, target : 800 x
Source: Mirae Asset Sekuritas Indonesia Research Source: Mirae Asset Sekuritas Indonesia Research Source: Mirae Asset Sekuritas Indonesia Research
Created w ith AmiBroker - advanced charting and technical analysis sof tw are. http://w w w .amibroker.com DOID.JK - Daily 3/9/2017 Open 720, Hi 745, Lo 685, Close
730 720 708.976 697.953 686.929 675.905 731.024 742.047 753.071 764.095
Feb Mar
Optimization Trading System - ©2010
DOID.JK - Volume = 74,069,696.00, Avg.Volume = 84,982,032.00
74,069,696 84,982,032
Created w ith AmiBroker - advanced charting and technical analysis sof tw are. http://w w w .amibroker.com DOID.JK - Weekly 3/9/2017 Open 765, Hi 785, Lo 685, Close
730 720.431 699.612 678.793 657.974 741.25 762.069 782.888 803.707 824.526
Jul Oct 2017
Optimization Trading System - ©2010
DOID.JK - Volume = 264,551,296.00, Avg.Volume = 405,035,936.00
264,551,296 405,035,936
Created w ith AmiBroker - advanced charting and technical analysis sof tw are. http://w w w .amibroker.com DOID.JK - Monthly 3/9/2017 Open 705, Hi 785, Lo 685, Close
730 726.25 688.735 651.219 613.704 576.189 763.765 801.281 838.796 876.311
2015 2016 2017
Optimization Trading System - ©2010
DOID.JK - Volume = 418,578,240.00, Avg.Volume = 1,569,969,408.00
418,578,240 1,569,969,408
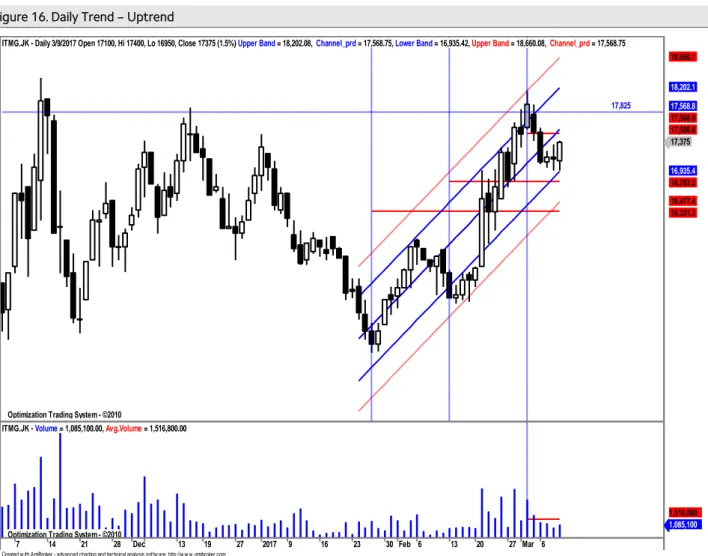
Indo Tambangraya Megah (ITMG) – Trading Buy
Harga akan coba naik dan tembus center line pada uptrend channel.
Secara umum harga saham ini akan coba naik dan tembus center line pada uptrend channel yang masih relatif valid dengan r-squared = 0.81 selama 32 hari terakhir dan bergerak normal dalam rentang +/-1.33 std.deviasi dari centerline. Peluang harga keluar dari pergerakan normalnya sekitar 19.33 % (sekitar 6 bar chart ). Volatilitas normal pergerakan harga saham ini sepanjang uptrend channel sebesar +/- 1.81 % atau sekitar +/- 313.78 (potensi naik dan turun secara normal maksimum/minimum sebesar 325 rupiah) dari level penutupan terakhir sebagaimana terlihat pada Figure 16.
Summary
Item Data Item Data
Close (March 9, 2017) 17,375(+1.5%) Trading range 16,800-17,825
Relative Avg. Price performance to JCI (%) 7.32 Target
β (beta) 0.24 - Daily 17,525
Corelation 0.57 - Weekly 18,175
Period 32 - Monthly 18,900
r-squared 0.81 Stop loss 16,325
Volatility (+/-, %) 1.81
Volatility (+/-, Rp.) 313.78
Source: Mirae Asset Sekuritas Indonesia Research
Figure 16. Daily Trend – Uptrend
Source: Mirae Asset Sekuritas Indonesia Research
Created w ith AmiBroker - advanced charting and technical analysis softw are. http://w w w .amibroker.com Optimization Trading System - ©2010
Optimization Trading System - ©2010 Optimization Trading System - ©2010 Optimization Trading System - ©2010 Optimization Trading System - ©2010
17,825 ITMG.JK - Daily 3/9/2017 Open 17100, Hi 17400, Lo 16950, Close 17375 (1.5%) Upper Band = 18,202.08, Channel_prd = 17,568.75, Lower Band = 16,935.42, Upper Band = 18,660.08, Channel_prd = 17,568.75
17,375
16,935.4 16,783.2 16,477.4 16,331.3 17,508.8 17,568.8 17,568.8 18,202.1 18,660.1
7 14 21 28 Dec 13 19 27 2017 9 16 23 30 Feb 6 13 20 27 Mar 6
Optimization Trading System - ©2010
ITMG.JK - Volume = 1,085,100.00, Avg.Volume = 1,516,800.00
1,085,100 1,516,800
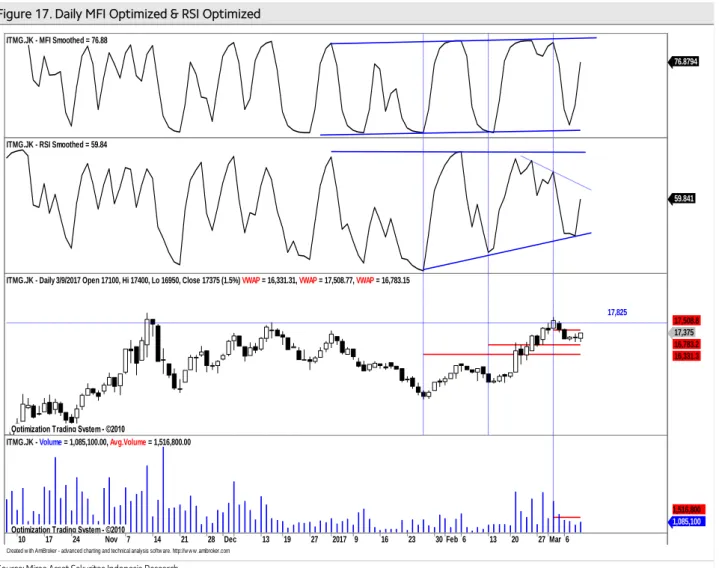
14 Aliran dana masuk dan volatilitas harga naik masih terlihat.
Pada Figure 17, terlihat dari hasil optimalisasi, indikator MFI Optimized dan indikator RSI Optimized masih cenderung naik dengan volume sekitar rata-rata. Dengan demikian diperkirakan potensi kenaikkan masih terlihat. Perkiraan resistance terdekat ke 17,825.
Support terdekat di 16,800,Stop loss level 16,325.
Figure 17. Daily MFI Optimized & RSI Optimized
Source: Mirae Asset Sekuritas Indonesia Research
Created w ith AmiBroker - advanced charting and technical analysis softw are. http://w w w .amibroker.com ITMG.JK - MFI Smoothed = 76.88
76.8794
ITMG.JK - RSI Smoothed = 59.84
59.841
Optimization Trading System - ©2010 Optimization Trading System - ©2010 Optimization Trading System - ©2010
17,825 ITMG.JK - Daily 3/9/2017 Open 17100, Hi 17400, Lo 16950, Close 17375 (1.5%) VWAP = 16,331.31, VWAP = 17,508.77, VWAP = 16,783.15
17,375 16,783.2 16,331.3 17,508.8
10 17 24 31Nov 7 14 21 28 Dec 13 19 27 2017 9 16 23 30 Feb 6 13 20 27 Mar 6
Optimization Trading System - ©2010
ITMG.JK - Volume = 1,085,100.00, Avg.Volume = 1,516,800.00
1,085,100 1,516,800
Harga akan coba naik mendekti resistance 2 pada masing-masing periode.
Untuk naik lebih lanjut harga harus mampu bertahan sekitar rata-ratamasing-masing periode dengan target terdekat berikutnya minimal ke resistance 2 sebagaimana terlihat pada Figure 18,19 dan 20.
Figure 18. Daily, target : 17,525 Figure 19. Weekly, target : 18,175 Figure 20. Monthly, target : 18,900
Source: Mirae Asset Sekuritas Indonesia Research Source: Mirae Asset Sekuritas Indonesia Research Source: Mirae Asset Sekuritas Indonesia Research
analyzed by : Tasrul, [email protected], +62-21- 5151140
Relative Avg.Price Performance to JCI (%) : Persentase kenaikan harga saham dari rata-rata sejak IHSG memulai uptrend-nya β (beta) : Indikator sensitivitas harga saham terhadap IHSG, beta diatas 1 berarti harga makin sensitif terhadap pergerakan IHSG dan sebaliknya
Correlation : Ukuran kuat hubungan (korelasi) pergerakan harga saham dibanding dengan pergerakan IHSG
Period : Periode uptrend / downtrend yang valid dari pergerakan harga saham
r-squared : Koefisien determinasi, menunjukkan persentase gerakan yang dapat dijelaskan dengan regresi linier.Nilai R2 terletak antara 0 – 1, dan kecocokan model dikatakan lebih baik kalau R2 semakin mendekati 1 (validitas uptrend atau downtrend makin valid) Volatility (+/-%) : Besaran volatilitas normal maksimal/minimal dari pergerakan harga harian selama harga saham bergerak normal pada trend channel dalam persentase.
Volatility (+/- point or Rp) : Besaran volatilitas normal maksimal/minimal dari pergerakan harga harian selama Harga saham bergerak
Buy: : Beli, harga sudah menyentuh atau jatuh di bawah support dan indikator teknikal berada di oversold area.
Sell: : Jual, harga sudah menyentuh atau tembus resistance normal dan indikator berada di overbought area.
BoW: : Buy on Weakness, beli ketika harga sudah melemah, dimana Volume tekanan jual mulai berkurang dan harga mendekati support, serta indikator teknikal sudah berada di oversold area.
SoS: : Sell on Strength, jual ketika kenaikan harga sudah mulai terbatas dimana volume beli mulai berkurang dan harga mendekati resistance, serta indikator teknikal sudah berada di overbought area.
Trading Buy: : Beli dan jual kembali secepatnya jika harga sudah mencapai level resistance terdekat, karena kenaikan harga relatif tidak stabil atau hanya sementara.
Trading Sell : Jual dan beli kembali secepatnya jika harga sudah mencapai level support terdekat karena koreksi harga relative tidak stabil atau hanya sementara.
Created w ith AmiBroker - advanced charting and technical analysis sof tw are. http://w w w .amibroker.com ITMG.JK - Daily 3/9/2017 Open 17100, Hi 17400, Lo 16950,
17,375 17,363.1 17,206.3 17,049.4 16,892.5 16,735.6 16,578.7 17,520 17,676.9 17,833.8
Feb Mar
Optimization Trading System - ©2010
ITMG.JK - Volume = 1,085,100.00, Avg.Volume = 1,516,800.00
1,085,100 1,516,800
Created w ith AmiBroker - advanced charting and technical analysis sof tw are. http://w w w .amibroker.com ITMG.JK - Weekly 3/9/2017 Open 17525, Hi 17600, Lo 16950,
17,375 17,362.5 16,958.6 16,554.8 16,150.9 15,747.1 17,766.4 18,170.2 18,574.1 18,977.9
Jul Oct 2017
Optimization Trading System - ©2010
ITMG.JK - Volume = 4,357,000.00, Avg.Volume = 6,295,400.00
4,357,000 6,295,400
Created w ith AmiBroker - advanced charting and technical analysis sof tw are. http://w w w .amibroker.com ITMG.JK - Monthly 3/9/2017 Open 17600, Hi 18150, Lo 16950,
17,375 16,125.2 14,731.6 13,338.1 11,944.5 17,518.8 18,912.3 20,305.9 21,699.4 23,093
2015 2016 2017
Optimization Trading System - ©2010
ITMG.JK - Volume = 10,501,600.00, Avg.Volume = 34,230,356.00
10,501,600 34,230,356
16
Chart 21. JCI Vs. USD/IDR Chart 22. JCI performance (absolute vs. relative)
Source: Bloomberg, Mirae Asset Sekuritas Indonesia Note: Relative to MSCI EM Index
Source: Bloomberg, Mirae Asset Sekuritas Indonesia
Chart 23. Foreigner’s net purchase (EM) Chart 24. Energy price
Note: The latest figure for India are March 8th, 2017
Source: Bloomberg, Mirae Asset Sekuritas Indonesia Source: Bloomberg, Mirae Asset Sekuritas Indonesia
Chart 25. Non-ferrous metal price Chart 26. Precious metal price
Source: Bloomberg, Mirae Asset Sekuritas Indonesia Source: Bloomberg, Mirae Asset Sekuritas Indonesia 12,800
13,000 13,200 13,400 13,600 13,800 14,000
4,300 4,500 4,700 4,900 5,100 5,300 5,500
12/8 1/5 2/2 3/2
(IDR)
(pt) JCI (L) USD/IDR (R)
0.2
-0.1
0.6
12.7
1.4 1.3 0.9
-4.5 -8
-4 0 4 8 12 16
1D 1W 1M 1Y
Absolute Relative (%, %p)
390
-368 12
-9 -1 0
849
-449 35
-224 4
477
-600 -400 -200 0 200 400 600 800 1,000
Korea Taiwan Indonesia Thailand Philippines India
1 Day 5 Days
(USDmn) (USDmn) (USDmn) (USDmn)
80 85 90 95 100 105 110
12/16 12/16 1/17 1/17 2/17 2/17 3/17
CPO WTI Coal
(
( (D-3M=100)
70 75 80 85 90 95 100 105 110
12/16 12/16 1/17 1/17 2/17 2/17 3/17
(D-3M=100) Copper Nickel Tin
( ( ( (
80 85 90 95 100 105 110 115
12/16 12/16 1/17 1/17 2/17 2/17 3/17
Silver Gold Platinum
Table. Key valuation metrics
Company Name Ticker
Price Market Cap Price Performance (%) P/E(X)* P/B(X)* ROE(%)*
(IDR) (IDRbn) 1D 1W 1M 1Y FY16 FY17 FY16 FY17 FY16 FY17
Jakarta Composite Index JCI 5,402 5,888,707 0.2 -0.1 0.6 12.3 15.6 13.6 2.3 2.1 18.1 14.2
FINANCIALS
Bank Central Asia BBCA 15,625 385,235 0.8 0.8 0.0 16.6 17.1 15.1 3.0 2.6 18.9 18.5
Bank Mandiri Persero BMRI 11,375 265,417 0.4 0.4 -0.9 13.8 19.6 13.2 1.8 1.6 10.3 12.7
Bank Rakyat Indonesia Persero BBRI 12,075 297,880 0.6 1.9 0.8 6.6 10.9 10.7 1.9 1.8 20.2 18.4
Bank Negara Indonesia Persero BBNI 6,400 119,351 2.0 2.8 3.2 21.3 9.1 9.0 1.2 1.3 13.9 14.5
Bank Tabungan Negara Persero BBTN 2,080 22,027 1.5 -1.9 8.6 24.2 13.3 12.3 1.0 1.2 7.6 10.0
CONSUMER
HM Sampoerna HMSP 3,980 462,946 -0.3 -2.7 2.8 -5.2 34.8 34.8 13.0 12.9 38.6 37.5
Gudang Garam GGRM 63,625 122,420 1.3 -3.4 2.0 0.8 16.1 14.1 2.7 2.4 17.8 18.0
Indofood CBP Sukses Makmur ICBP 8,150 95,045 -0.6 -1.2 -4.1 5.2 23.6 21.2 4.9 4.4 21.5 21.8
Indofood Sukses Makmur INDF 8,000 70,243 0.3 -0.3 0.6 8.8 15.8 14.0 2.2 2.0 13.7 14.7
Kalbe Farma KLBF 1,460 68,438 -2.7 -1.0 -1.4 9.0 26.9 24.0 5.1 4.7 20.0 20.5
Unilever Indonesia UNVR 42,425 323,703 0.0 0.8 1.4 -2.5 44.9 39.6 56.1 52.2 131.9 139.0
AGRICULTURAL
Astra Agro Lestari AALI 15,225 29,303 0.2 -0.7 -2.4 1.1 14.8 15.5 1.9 1.7 14.1 11.0
PP London Sumatera Indonesia LSIP 1,470 10,030 -2.3 -3.6 -4.9 -4.9 20.0 13.0 1.6 1.2 7.9 9.7
Sawit Sumbermas Sarana SSMS 1,480 14,097 5.7 0.3 -9.8 -24.9 20.1 16.1 3.5 3.0 17.5 18.8
INFRASTRUCTURE
XL Axiata EXCL 2,960 31,636 4.6 1.7 -3.9 -27.4 60.8 69.3 1.2 1.4 2.1 1.7
Jasa Marga JSMR 4,530 32,878 -1.1 -5.8 -3.2 -14.3 15.6 17.9 2.3 2.2 15.7 12.3
Perusahaan Gas Negara PGAS 2,720 65,937 -0.7 -1.8 -3.2 1.5 11.3 10.7 1.4 1.3 12.7 12.4
Tower Bersama Infrastructure TBIG 4,990 22,612 -2.6 0.6 -8.0 -16.8 17.3 14.9 7.2 5.2 47.0 39.2
Telekomunikasi Indonesia TLKM 3,960 399,168 2.1 3.4 2.3 17.3 20.3 17.3 4.7 4.1 24.3 23.9
Soechi Lines SOCI 278 1,962 0.0 -4.1 -6.7 -42.8 3.5 N/A N/A N/A 11.3 N/A
Garuda Indonesia GIAA 340 8,801 0.0 0.0 0.0 -20.6 20.7 14.6 2.5 2.3 11.8 15.2
BASIC-INDUSTRIES
Semen Indonesia SMGR 9,250 54,867 -0.8 -1.9 -3.9 -11.1 12.0 14.0 1.9 1.8 16.3 13.1
Charoen Pokphand Indonesia CPIN 3,200 52,474 3.9 0.9 -2.7 -5.2 15.4 12.8 3.1 2.6 21.2 21.5
Indocement Tunggal Prakarsa INTP 15,500 57,059 0.6 0.6 -3.0 -23.8 15.6 14.6 2.0 1.9 13.4 13.9
Japfa Comfeed Indonesia JPFA 1,650 18,827 -1.8 -3.2 -7.3 107.5 7.7 10.2 1.9 1.9 28.6 20.1
MINING
Indo Tambangraya Megah ITMG 17,375 19,632 1.5 -3.2 11.0 147.3 10.4 8.3 1.5 1.5 15.0 17.9
Adaro Energy ADRO 1,685 53,896 -0.6 0.0 -2.3 113.3 12.0 10.5 1.3 1.2 11.1 10.0
Aneka Tambang ANTM 735 17,663 0.7 -4.5 -8.1 73.3 298.3 35.8 1.2 1.0 0.4 2.5
Vale Indonesia INCO 2,350 23,350 -4.5 -8.2 -11.3 20.8 N/A 35.1 1.1 0.9 0.1 2.5
Tambang Batubara Bukit Asam PTBA 10,850 25,000 0.5 -3.1 -2.0 63.8 8.9 8.6 2.0 1.7 21.5 20.9
TRADE
United Tractors UNTR 25,900 96,611 1.2 3.3 13.8 68.7 15.8 15.6 1.9 2.2 12.7 14.2
AKR Corporindo AKRA 6,225 24,849 1.6 -0.4 -5.3 -19.2 23.5 19.7 3.5 3.2 15.7 17.0
Global Mediacom BMTR 525 7,454 -0.9 -5.4 -11.8 -43.5 N/A N/A N/A N/A N/A N/A
Matahari Department Store LPPF 13,225 38,589 1.3 2.3 -13.7 -21.3 21.9 16.9 23.8 13.9 136.4 91.7
Media Nusantara Citra MNCN 1,655 23,627 0.0 -0.3 -1.8 -11.7 13.0 11.5 2.1 1.9 16.8 17.4
Matahari Putra Prima MPPA 1,195 6,427 -2.8 -2.0 -9.1 -33.2 33.1 26.7 2.3 2.1 5.9 7.9
Surya Citra Media SCMA 2,740 40,063 -2.1 -5.2 -6.5 -4.5 21.9 19.2 9.7 8.3 46.6 46.0
Siloam International Hospital SILO 13,650 17,753 5.0 7.1 3.4 73.4 150.3 117.7 4.5 6.4 3.5 4.9
PROPERTY
Bumi Serpong Damai BSDE 1,765 33,970 0.0 -1.1 -7.1 2.9 14.0 12.8 1.5 1.3 10.6 10.8
Adhi Karya ADHI 2,290 8,154 -1.3 5.0 17.4 -13.6 23.6 13.7 1.4 1.3 5.9 10.3
Alam Sutera Realty ASRI 368 7,231 -1.1 -0.5 -4.7 1.1 8.5 6.3 0.9 0.8 10.9 12.7
Ciputra Development CTRA 1,280 23,757 -1.2 -1.9 -7.2 -1.3 16.2 13.4 1.9 1.7 12.5 12.8
Lippo Karawaci LPKR 730 16,847 0.7 0.7 -4.6 -31.1 18.6 14.8 0.9 0.9 5.0 6.5
Pembangunan Perumahan PTPP 3,400 21,080 -2.3 -5.0 -8.8 -4.0 23.1 15.0 2.4 2.0 14.4 16.2
Pakuwon Jati PWON 585 28,173 0.9 1.7 4.5 23.9 13.9 11.4 2.7 2.2 20.5 20.5
Summarecon Agung SMRA 1,360 19,620 -1.1 -1.1 3.0 -14.7 38.6 29.8 2.9 2.8 7.6 9.6
Wijaya Karya WIKA 2,480 22,245 1.2 -1.2 -0.4 6.1 14.4 18.5 1.8 1.9 12.9 11.4
Waskita Karya WSKT 2,420 32,848 -0.8 -0.8 -5.8 27.7 17.3 14.4 3.1 2.0 16.6 16.6
MISCELLANEOUS
Astra International ASII 8,250 333,989 -1.8 -2.7 2.2 22.7 22.1 17.3 3.0 2.7 14.2 15.9
Source: Bloomberg, Mirae Asset Sekuritas Indonesia
*Note: Valuation metrics based on Bloomberg consensus estimates
18
Sector performance Top 10 market cap performance
Name Index Chg (%) Ticker Price Market Cap (IDRbn) Chg (%)
Agricultural 1,841.7 0.2 DNET IJ 1710 24,255 6.88
Mining 1,393.9 -1.2 AUTO IJ 2680 12,917 6.35
Basic-Industry 561.7 0.3 MEGA IJ 2550 17,758 6.25
Miscellaneous Industry 1,397.3 -1.5 SSMS IJ 1480 14,097 5.71
Consumer Goods 2,390.7 -0.2 SILO IJ 13650 17,753 5.0
Property & Construction 504.0 -0.4 EXCL IJ 2960 31,636 4.59
Infrastructure 1,070.9 1.1 FASW IJ 4800 11,894 4.58
Finance 836.5 0.6 ACES IJ 790 13,549 3.95
Trade 872.2 0.6 CPIN IJ 3200 52,474 3.9
Composite 5,402.4 0.2 INAF IJ 2730 8,461 3.41
Source: Bloomberg
Top 5 leading movers Top 5 lagging movers
Name Chg (%) Close Name Chg (%) Close
TLKM IJ 2.1 3,960 ASII IJ -1.8 8,250
BBCA IJ 0.8 15,625 GEMS IJ -14.1 2,560
BBNI IJ 2.0 6,400 KLBF IJ -2.7 1,460
CPIN IJ 3.9 3,200 HMSP IJ -0.3 3,980
BBRI IJ 0.6 12,075 INCO IJ -4.5 2,350
Source: Bloomberg
Economic Calendar
Time Currency Detail Forecast Previous
1:01am USD 30-y Bond Auction 3.01|2.3
6:50am JPY BSI Manufacturing Index 8.4 7.5
7:30am AUD Home Loans m/m -0.9% 0.4%
2:00pm EUR German Trade Balance 119.2B 18.4B
2:45pm EUR French Industrial Production m/m 0.6% -0.9%
4:00pm EUR Italian Quarterly Unemployment Rate 11.6% 11.6%
4:30pm GBP Manufacturing Production m/m -0.6% 2.1%
4:30pm GBP Goods Trade Balance -11.1B -10.9B
4:30pm GBP Construction Output m/m -0.3% 1.8%
4:30pm GBP Consumer Inflation Expectations 2.8%
4:30pm GBP Industrial Production m/m -0.4% 1.1%
Day 2 EUR ECOFIN Meetings
8:30pm CAD Employment Change 48.3K
8:30pm CAD Unemployment Rate 6.8%
8:30pm USD Average Hourly Earnings m/m 0.3% 0.1%
8:30pm USD Non-Farm Employment Change 185K 227K
8:30pm USD Unemployment Rate 4.7% 4.8%
10:00pm GBP NIESR GDP Estimate 0.7%
Note: Time is based on Indonesian local time Source: Forex Factory
Disclaimers
This report is prepared strictly for private circulation only to clients of PT Mirae Asset Sekuritas Indonesia (MASI). It is purposed only to person having professional experience in matters relating to investments. The information contained in this report has been taken from sources which we deem reliable. No warranty (express or implied) is made to the accuracy or completeness of the information. All opinions and estimates included in this report constitute our judgments as of this date, without regards to its fairness, and are subject to change without notice. However, none of MASI and/or its affiliated companies and/or their respective employees and/or agents makes any representation or warranty (express or implied) or accepts any responsibility or liability as to, or in relation to, the accuracy or completeness of the information and opinions contained in this report or as to any information contained in this report or any other such information or opinions remaining unchanged after the issue thereof. We expressly disclaim any responsibility or liability (express or implied) of MASI, its affiliated companies and their respective employees and agents whatsoever and howsoever arising (including, without limitation for any claims, proceedings, action, suits, losses, expenses, damages or costs) which may be brought against or suffered by any person as a results of acting in reliance upon the whole or any part of the contents of this report and neither MASI, its affiliated companies or their respective employees or agents accepts liability for any errors, omissions or misstatements, negligent or otherwise, in the report and any liability in respect of the report or any inaccuracy therein or omission there from which might otherwise arise is hereby expresses disclaimed.
This document is not an offer to sell or a solicitation to buy any securities. This firms and its affiliates and their officers and employees may have a position, make markets, act as principal or engage in transaction in securities or related investments of any company mentioned herein, may perform services for or solicit business from any company mentioned herein, and may have acted upon or used any of the recommendations herein before they have been provided to you. © PT Mirae Asset Sekuritas Indonesia 2016.