6
DAEWOO INDONESIA Embun Pagi (Oct 20, 2016)
Market Indicator
JCI: 5,409.29 (-0.38%) EIDO: 26.59 (+0.19%)
FTSE100: 7,021.92 (+0.31%)
USD/IDR: 13,008 (-0.13%) 10yr GB yield: 7.15% (+4 bps) Oil Price: 51.60 (+2.60%)
Stock Watch
INDY (Sell on Strength), GGRM (Trading Buy), GJTL (Trading Buy)
TOP BUY: TLKM, ADRO, BBCA, GGRM, EXCL TOP SELL: PGAS, UNVR, UNTR, INDF, ITMG
Foreign Net Purchase: -IDR64.5 bn
Foreign Most Active: BUMI, ASII, MYRX, PGAS, TLKM
Christine Natasya +62-21-515-1140 [email protected] To subscribe to our Daily Focus, please contact us at [email protected]
Daewoo Securities Indonesia Research
Oil consumption vs production
Source: BP Statistical review, Daewoo Securities Indonesia Research
Embun Pagi
Indonesia oil sector: a new hope
Reducing oil imports to tackle current account deficit
Konsumsi minyak Indonesia sangat besar, melampaui produksi sehingga Indonesia mengimpor minyak sebesar c.350,000bpd dari beberapa negara. Kami percaya Indonesia berencana untuk mengurangi impor, agar neraca perdagangan surplus.
Selain itu, kita berpikir eksplorasi minyak akan ditingkatkan dalam rangka meningkatkan produksi cadangan minyak Indonesia, yang mana akan mendorong pertumbuhan perusahaan kapal yang melayani explorasi lepas pantai (OSV), seperti Logindo (LEAD IJ-Not rated) dan Wintermar (WINS IJ, Not-rated), dalam pandangan kami.
Indonesia lags behind in exploration of crude oil
Kurangnya eksplorasi dan investasi minyak mentah, produksi minyak mentah Indonesia mengalami tren penurunan. Kami pikir, beberapa alasan yang menyebabkan kurangnya eksplorasi seperti rintangan birokrasi, serta ketidakpastian hukum mengenai kontrak tampaknya menciptakan hambatan untuk mendapatkan investasi dari investor, terutama karena investasi O&G melibatkan biaya tinggi dan investasi jangka panjang. Kami menyadari bahwa cadangan minyak Indonesia yang tersisa dapat bertahan 12 tahun di 2015, hampir terkecil dibandingkan dengan kawasan Asia Pasifik lainnya dengan Vietnam memiliki cadangan tertinggi di c.33 tahun, dan Thailand c.2 tahun.
Expect a better Indonesian O&G outlook
Baru-baru ini, Presiden Joko Widodo baru saja melantik Jonan (mantan Menteri Perhubungan Indonesia) sebagai menteri energi dan sumber daya mineral dan Arcandra sebagai wakilnya. Kami mengharapkan mereka memiliki beberapa transformasi dalam sistem sumber daya energi Indonesia dengan mendorong eksplorasi minyak lebih lanjut.
Market Index
Last Trade Chg (%) MoM YoY
JCI 5,409.3 -0.4 2.4 18.4
MSCI Indonesia 26.6 0.2 3.0 26.7
MSCI EM 913.4 0.5 1.1 5.1
HANG SENG 23,305.0 -0.4 -0.6 1.8
KOSPI 2,040.4 0.2 0.7 0.1
FTSE 7,021.9 0.3 2.5 10.3
DJIA 18,202.6 0.2 0.2 5.5
NASDAQ 5,246.4 0.0 0.0 7.4
Valuation
2016F P/E (x) P/B (x) ROE (%)
JCI 17.8 2.5 17.5
Key Rates
Last Trade Chg (bps) MoM YoY
BI 7-Day RR 5.00 -25 -25 N/A
3yr 6.83 0 12 -157
10yr 7.11 2 13 -155
FX
Last Trade Chg (%) MoM YoY
USD/IDR 13,008.00 -0.1 -1.0 -3.6
USD/KRW 1,129.38 -0.8 1.0 0.7
USD/JPY 103.44 -0.4 1.7 -13.7
USD/CNY 6.74 0.1 1.1 6.0
Commodities
Last Trade Chg (%) MoM YoY
WTI 51.6 2.6 17.1 0.6
Gold 1,269.2 0.5 -3.5 7.9
Coal 40.0 0.0 0.0 -4.6
Palm Oil 715.0 -1.4 -0.7 11.9
Rubber 130.7 0.0 3.5 28.4
Nickel 10,410.0 1.2 2.6 0.3
Copper 4,681.0 0.1 -2.0 -10.1
Tin 19,925.0 1.5 1.4 23.0
JCI Index VS MSCI Emerging Markets
650 800 950 1,100
3,500 4,500 5,500
09/13 06/14 03/15 12/15 09/16
(pt) JCI MSCI EM (pt)
950 1,100 5,500
(pt) JCI MSCI EM (pt)
- 200 400 600 800 1,000 1,200 1,400 1,600 1,800
2005 2006 2007 2008 2009 2010 2011 2012 2013 2014 2015 Consumption (th of barrels/day)
Production (th of barrels/day)
Daewoo cartoon
Local flashes
WSKT: Waskita Karya dapat pinjaman sindikasi Rp4,59 triliun. PT Waskita Karya Tbk (WSKT) telah memperoleh fasilitas pinjaman sebesar Rp4,59 Triliun yang berasal dari beberapa bank yakni PT Bank Negara Indonesia Tbk, PT Bank Rakyat Indonesia Tbk, The Bank of Tokyo-Mitsubishi Ltd, PT Sarana Multi Infrastruktur (persero), Bank Pembangunan Daerah Sumatera Selatan-Bangka Belitung serta Bank Jabar Banten Tbk.
Fasilitas pinjaman ini akan digunakan untuk mendukung kegiatan usaha utama Waskita dalam bidang konstruksi. (Iqplus)
BUKK: Bukaka Teknik Utama raih pendapatan Rp947,26 miliar hingga September. PT Bukaka Teknik Utama Tbk (BUKK) meraih pendapatan sebesar Rp947,26 miliar hingga periode 30 September 2016 atau meningkat jika dibandingkan dengan pendapatan Rp787,06 miliar periode sama tahun sebelumnya. Beban usaha juga naik menjadi Rp128,33 miliar dibandingkan beban usaha Rp111,00 miliar periode hingga September tahun lalu. Laba bersih yang dapat didistribusikan kepada pemilik entitas induk mencapai Rp25,10 miliar meningkat dari laba hingga September tahun lalu yang Rp18,79 miliar. (Iqplus)
AGRO: Kredit BRI Agro tumbuh 35 persen. PT Bank Rakyat Indonesia Agroniaga Tbk pada kuartal III 2016 membukukan pertumbuhan kredit sebesar 35 persen dibandingkan periode yang sama tahun sebelumnya year on year (yoy) menjadi Rp 7,606 miliar. Direktur Bisnis Bank BRI Agro Zuhri Anwar menjelaskan, meski dalam situasi ekonomi yang lemah, tren kredit di perseroan tetap tumbuh jauh di atas rata- rata pertumbuhan industri bank di Indonesia. (Republika)
TAXI: Fitch tarik peringkat Express Transindo. Lembaga pemeringkat Fitch Ratings menarik peringkat nasional jangka panjang PT Express Transindo Utama di "idnA-"
dengan prospek negative, karena perusahaan taksi itu berhenti berpartisipasi dalam proses pemeringkatan. Fitch menyebut, peringkat 'A" menunjukkan ekspektasi risiko gagal bayar yang relatif rendah terhadap emiten atau surat utang lain di Indonesia.
Namun, perubahan kondisi ekonomi bisa saja memengaruhi kemampuan membayar utang dibandingkan dengan obligor yang memiliki peringkat lebih tinggi. (Bisnis Indonesia)
BBNI: BNI buka cabang di Raja Ampat. PT Bank Negara Indonesia Tbk (BNI) melakukan perluasan layanan ke Wilayah Timur Indonesia. Bank BUMN ini membuka outlet baru di ibu kota Kabupaten Raja Ampat, Papua Barat, yaitu Waisai. Kantor BNI Cabang Waisai ini akan menambah cakupan layanan BNI di Papua Barat yang saat ini sudah ada di 5 kabupaten atau kota dengan jumlah outlet sebanyak 9 outlet serta diperkuat dengan 52 ATM. (DetikFinance)
ELTY: ELTY raih laba Rp71,8 miliar. PT Bakrie Development Tbk (ELTY) berhasil membukukan laba sebesar Rp71,8 miliar per 30 Juni 2016 dari kerugian sebesar Rp83,09 miliar pada periode yang sama tahun 2015. Pada periode tersebut, perseroan membukukan penghasilan usaha bersih mencapai Rp512,2 miliar dari Rp629,1 miliar.
Untuk beban pokok penghasilan sebesar Rp287,8 miliar dari Rp323,3 miliar. Jadi laba kotor mencapai Rp224,3 miliar dari Rp305,7 miliar. (Inilah)
Technical analysis
Tasrul +62-21-515-1140 [email protected]
Jakarta Composite Index (JCI) – Consolidation
IHSG akan coba bertahan di atasnormal lower band pada uptrend channel.
IHSG saat masih dalam polauptrend relatif valid yang dimulai sejak selama 118 hari terakhir dengan r-squared = 0.8129 dan bergerak normal dalam rentang +/- 1.32 std.deviasi daricenterline. Peluang IHSG bergerak di luar pergerakan normal sekitar 18.71% atau sekitar 22bar chart. Volatilitas normal pergerakan IHSG saat ini sebesar +/- 0.51 % atau sekitar +/-27.36point. IHSG akan coba bertahan diatas normal lower band padauptrend channel sebagaimana terlihat pada Figure 1.
Summary
Item Data Item Data
Close (Oct 19, 2016) 5,409.29(-0.4%)Trading range 5,375-5,423
Average index performance (%) 4.60Target
Period 118 - Daily 5,450
r-squared 0.8129 - Weekly 5,476
Volatility (+/-, %) 0.51 - Monthly 5,486
Volatility (+/-, point) 27.36Stop loss 5,375
Source: Daewoo Securities Indonesia Research Figure 1. Daily trend - Uptrend
Source: Daewoo Securities Indonesia Research
Created with AmiBroker - advanced charting and technical analysis software. http://www.amibroker.com Optimization Trading System - ©2010
Optimization Trading System - ©2010 Optimization Trading System - ©2010 Optimization Trading System - ©2010 Optimization Trading System - ©2010
5,451 5,423
^JKSE-Daily10/19/2016Open5436.28, Hi 5445.8, Lo5402.15, Close5409.29(-0.4%)UpperBand=5,696.00,Channel_prd=5,543.39,LowerBand=5,390.77,VWAP=5,284.36,VWAP=5,375.73,VWAP=
5,409.29 5,401.83 5,390.77 5,375.73 5,290.52 5,284.36 5,543.39 5,544.95 5,696 5,799.38
25 May 16 23 30 Jun 6 13 20 27 Jul 18 25 Aug 8 15 22 29 Sep 13 19 26 Oct 10 17
Optimization Trading System - ©2010
^JKSE-Volume=11,689,492,480.00,Avg.Volume=6,727,214,080.00 11,689,492,480
6,727,214,080
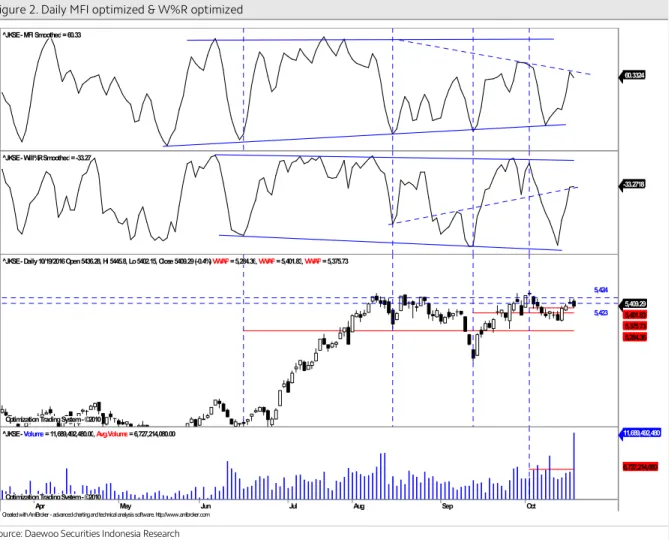
Aliran dana keluar dantrend turun volatilitas mulai terlihat.
Pada Figure 2, terlihat dari hasil optimalisasi terakhir, indikator MFI optimized dan indikator W%R optimized mulai turun dengan volume tembus rata-rata, dengan demikian potensi koreksi mulai terlihat namun masih terbatas. Resistance terdekat sekitar 5,423 sebelum ke 5,451. Sementarasupport di 5,375 yang sekaligus sebagai stop loss level.
Figure 2. Daily MFI optimized & W%R optimized
Source: Daewoo Securities Indonesia Research
Created with AmiBroker - advanced charting and technical analysis software. http://www.amibroker.com
^JKSE-MFI Smoothed=60.33
60.3324
^JKSE-Will%RSmoothed=-33.27
-33.2718
Optimization Trading System - ©2010 Optimization Trading System - ©2010 Optimization Trading System - ©2010
5,423 5,424
^JKSE-Daily10/19/2016Open5436.28, Hi 5445.8, Lo5402.15, Close5409.29(-0.4%)VWAP=5,284.36,VWAP=5,401.83,VWAP=5,375.73
5,409.29 5,401.83 5,375.73 5,284.36
Apr May Jun Jul Aug Sep Oct
Optimization Trading System - ©2010
^JKSE-Volume=11,689,492,480.00,Avg.Volume=6,727,214,080.00 11,689,492,480
6,727,214,080
IHSG akan coba bertahan sekitar rata-rata pada masing-masing periode.
Untuk mampu naik lebih lanjut IHSG saat ini harus mampu bertahan minimal diatas rata- rata masing masing periode atau sekitar level 5,407-5,423 dengan target normal kenaikkan ke level R2 untuk masing-masing periode sebagaimana terlihat padaFigure 3,4 dan 5.
Figure 3. Daily, target :5,450 Figure 4. Weekly, target :5,476 Figure 5. Monthly,target :5,486 x
Source: Daewoo Securities Indonesia Research Source: Daewoo Securities Indonesia Research Source: Daewoo Securities Indonesia Research
Cr e a te d w ith A miB r o ke r - a d v a n c e d c h a r tin g a n d te c h n ic a l a n a ly s is s o f tw a r e . h ttp ://w w w .a mib r o ke r .c o m
^ JK S E - D a ily 10/19/2016 O p e n 5436.28, H i 5445.8, L o 5402.15,
5,409.29 5,396.02 5,382.34 5,368.66 5,409.7 5,423.38 5,437.06 5,450.74 5,464.42 5,478.1
S e p O ct
O p tim iz a tio n T ra d in g S yste m - © 2010
^ JK S E -V o lu m e= 11,689,492,480.00 ,A vg .V o lu m e= 6,727,214,080.00 11,689,492,480
6,727,214,080
Cr e a te d w ith A miB r o ke r - a d v a n c e d c h a r tin g a n d te c h n ic a l a n a ly s is s o f tw a r e . h ttp ://w w w .a mib r o ke r .c o m
^ JK S E - W e e kly 10/19/2016 O p e n 5390.96, H i 5446.83, L o 5386.22,
5,409.29 5,408.33 5,374.38 5,340.43 5,306.48 5,272.54 5,442.27 5,476.22 5,510.17 5,544.11
Ju l O ct
O p tim iz a tio n T ra d in g S yste m - © 2010
^ JK S E -V o lu m e= 24,154,355,712.00 ,A vg .V o lu m e= 26,044,585,984.00 24,154,355,712 26,044,585,984
Cr e a te d w ith A miB r o ke r - a d v a n c e d c h a r tin g a n d te c h n ic a l a n a ly s is s o f tw a r e . h ttp ://w w w .a mib r o ke r .c o m
^ JK S E - M o n th ly 10/19/2016 O p e n 5403.86, H i 5482.84, L o
5,409.29 5,407.02 5,327.13 5,247.25 5,167.36 5,087.48 5,486.9 5,566.79 5,646.67 5,726.55
2015 2016
O p tim iz a tio n T ra d in g S yste m - © 2010
^ JK S E -V o lu m e= 86,143,139,840.00 ,A vg .V o lu m e= 95,359,295,488.00
86,143,139,840 95,359,295,488
Stocks on our focus list
Indika Energy (INDY) – Sell on Strength
Harga akan coba naik mendekaticenterline pada uptrend channel.
Secara umum harga saham ini juga masih bergerak dalam polauptrend yang masih relatif valid (r-squared = 0.8721) selama 217 hari terakhir dan bergerak normal dalam rentang +/- 1.52 std.deviasi dari center line. Peluang harga keluar dari pergerakan normal sekitar 12.79 % (sekitar 28 bar chart ). Volatilitas normal pergerakan harga saham ini sepanjanguptrend channel sebesar + 3.10% atau sekitar +/- 22.13 (potensi naik dan turun secara normal maksimum/minimum sebesar20-25 rupiah) dari level penutupan kemarin. Saat ini harga akan coba naik mendekaticenterline pada uptrend channel sebagaimana terlihat pada Figure 6.
Summary
Item Data Item Data
Close (Oct 19, 2016) 715(+3.6%)Trading range 680-755
Relative Avg. Price performance to JCI (%) 20.31Target
β (beta) 1.78 - Daily 735
Corelation 0.70 - Weekly 755
Period 217 - Monthly 765
r-squared 0.8721Stop loss 670
Volatility (+/-, %) 3.10
Volatility (+/-, Rp.) 22.13
Source: Daewoo Securities Indonesia Research Figure 6. Daily trend – Uptrend
Source: Daewoo Securities Indonesia Research
Created with AmiBroker - advanced charting and technical analysis software. http://www.amibroker.com Optimization Trading System - ©2010
Optimization Trading System - ©2010
755 735 670 INDY.JK-Daily10/19/2016Open700, Hi 740, Lo695, Close715(3.6%)UpperBand=926.93,Channel_prd=798.44,LowerBand=669.95,VWAP=683.14
715 683.143 669.951 798.443 926.934
Dec 2016 Feb Mar Apr May Jun Jul Aug Sep Oct
Optimization Trading System - ©2010
INDY.JK-Volume=38,807,100.00,Avg.Volume=12,902,714.00
38,807,100 12,902,714
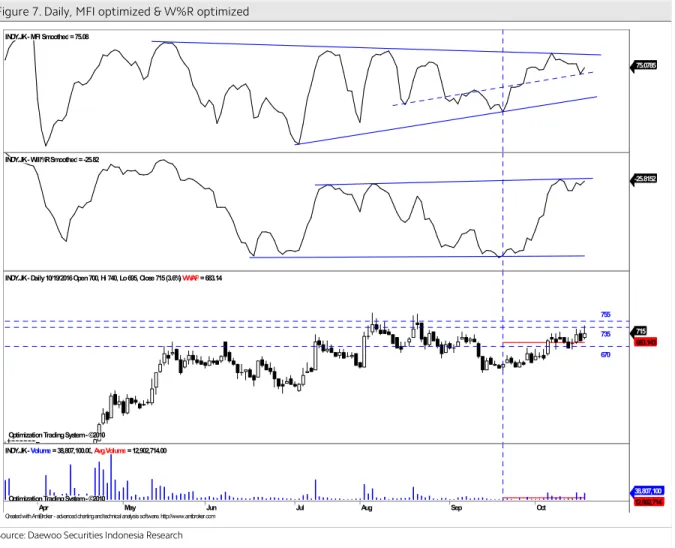
Aliran dana masuk masih terlihat dan trend naik volatilitas harga naik akan mencapai puncaknya.
PadaFigure 7, terlihat dari hasil optimalisasi terakhir, indikator MFI optimized saat ini masih cenderung naik dan indikatorW%R optimized akan mencapai resistance line dengan volume tembus rata-rata. Hal ini mengindikasikan potensi kenaikkan masih terlihat namun terbatas. Resistance terdekat di 735 sebelum ke 755 dan support terdekat di 685.Stop loss level di 670.
Figure 7. Daily, MFI optimized & W%R optimized
Source: Daewoo Securities Indonesia Research
Created with AmiBroker - advanced charting and technical analysis software. http://www.amibroker.com INDY.JK-MFI Smoothed=75.08
75.0785
INDY.JK-Will%RSmoothed=-25.82
-25.8152
Optimization Trading System - ©2010
670 755 735 INDY.JK-Daily10/19/2016Open700, Hi 740, Lo695, Close715(3.6%)VWAP=683.14
715 683.143
Apr May Jun Jul Aug Sep Oct
Optimization Trading System - ©2010
INDY.JK-Volume=38,807,100.00,Avg.Volume=12,902,714.00
38,807,100 12,902,714
Harga akan coba naik dan bertahan diatas rata-rata periodedaily dan weekly.
Untuk naik lebih lanjut harga harus mampu bertahan minimal sekitar rata-rata periode daily dan weekly atau sekitar level 700-715 dengan target normal ke resistance 2 untuk masing-masing periode. Sebagaimana terlihat padaFigure 8,9 dan 10.
Figure 8. Daily ,target : 735 Figure 9. Weekly, target : 755 Figure 10. Monthly,target : 765
Source: Daewoo Securities Indonesia Research Source: Daewoo Securities Indonesia Research Source: Daewoo Securities Indonesia Research
Cr e a te d w ith A m iB r o ke r - a d v a n c e d c h a r tin g a n d te c h n ic a l a n a ly s is s o f tw a r e . h ttp ://w w w .a m ib r o ke r .c o m IN D Y .J K - W e e k ly 1 0 /1 9 /2 0 1 6 O p e n 6 8 5 , H i 7 4 0 , L o 6 8 0 , C lo se
7 1 5 7 0 5 6 7 8 .0 0 8 6 5 1 .0 1 5 6 2 4 .0 2 3 5 9 7 .0 3 1 7 3 1 .9 9 2 7 5 8 .9 8 5 7 8 5 .9 7 7 8 1 2 .9 6 9
J u l O c t
O p tim iz a tio n T ra d in g S y ste m - © 2 0 1 0
IN D Y .J K -V o lu m e= 9 4 ,8 3 7 ,2 0 0 .0 0 ,A v g .V o lu m e= 5 1 ,9 7 4 ,2 3 2 .0 0
9 4 ,8 3 7 ,2 0 0 5 1 ,9 7 4 ,2 3 2
Cr e a te d w ith A m iB r o ke r - a d v a n c e d c h a r tin g a n d te c h n ic a l a n a ly s is s o f tw a r e . h ttp ://w w w .a m ib r o ke r .c o m IN D Y .J K - M o n th ly 1 0 /1 9 /2 0 1 6 O p e n 6 2 5 , H i 7 4 0 , L o 6 2 5 , C lo se
7 1 5 6 7 6 .2 5 5 8 8 .1 3 2 5 0 0 .0 1 4 4 1 1 .8 9 7 3 2 3 .7 7 9 7 6 4 .3 6 8 8 5 2 .4 8 6 9 4 0 .6 0 3 1 ,0 2 8 .7 2
2 0 1 5 2 0 1 6
O p tim iz a tio n T ra d in g S y ste m - © 2 0 1 0
IN D Y .J K -V o lu m e= 2 3 0 ,2 8 0 ,5 9 2 .0 0 ,A v g .V o lu m e= 6 0 6 ,5 1 4 ,7 5 2 .0 0
2 3 0 ,2 8 0 ,5 9 2 6 0 6 ,5 1 4 ,7 5 2
Cr e a te d w ith A m iB r o ke r - a d v a n c e d c h a r tin g a n d te c h n ic a l a n a ly s is s o f tw a r e . h ttp ://w w w .a m ib r o ke r .c o m IN D Y .J K - D a ily 1 0 /1 9 /2 0 1 6 O p e n 7 0 0 , H i 7 4 0 , L o 6 9 5 , C lo se
7 1 5 7 1 2 .5 7 0 1 .4 3 5 6 9 0 .3 6 9 6 7 9 .3 0 4 6 6 8 .2 3 9 7 2 3 .5 6 5 7 3 4 .6 3 1 7 4 5 .6 9 6 7 5 6 .7 6 1
S e p O c t
O p tim iz a tio n T ra d in g S y ste m - © 2 0 1 0
IN D Y .J K -V o lu m e= 3 8 ,8 0 7 ,1 0 0 .0 0 ,A v g .V o lu m e= 1 2 ,9 0 2 ,7 1 4 .0 0 3 8 ,8 0 7 ,1 0 0
1 2 ,9 0 2 ,7 1 4
Gudang Garam (GGRM) – Trading Buy
Harga akan coba naik mendekatinormal lower band pada uptrend channel.
Secara umum harga saham ini juga masih bergerak dalam polauptrend yang masih relatif valid (r-squared = 0.7436) selama 297 hari terakhir dan bergerak normal dalam rentang +/- 1.2 std.deviasi dari center line. Peluang harga keluar dari pergerakan normal sekitar 25.64 % (sekitar 76bar chart ). Volatilitas normal pergerakan harga saham ini sepanjanguptrend channel sebesar +/ 1.29 % atau sekitar +/-857.13 (potensi naik dan turun secara normal maksimum/minimum sebesar 850 rupiah) dari level penutupan kemarin. Saat ini harga akan naik mendekati normal lower band pada uptrend channel sebagaimana terlihat pada Figure 11.
Summary
Item Data Item Data
Close (Oct 19, 2016) 66,275 (+0.2%)Trading range 65,400-66,750
Relative Avg. Price performance to JCI (%) -2.23Target
β (beta) 0.93 - Daily 66,950
Corelation (0.48) - Weekly 67,550
Period 297 - Monthly 68,325
r-squared 0.7436Stop loss 63,725
Volatility (+/-, %) 1.29
Volatility (+/-, Rp.) 857.13
Source: Daewoo Securities Indonesia Research Figure 11. Daily trend – Uptrend
Source: Daewoo Securities Indonesia Research
Created with AmiBroker - advanced charting and technical analysis software. http://www.amibroker.com Optimization Trading System - ©2010
Optimization Trading System - ©2010 Optimization Trading System - ©2010 Optimization Trading System - ©2010 Optimization Trading System - ©2010
67,400 GGRM.JK-Daily10/19/2016Open66025, Hi 66425, Lo65725, Close66275(0.2%)UpperBand=79,450.33,Channel_prd=73,660.09,LowerBand=67,869.86,UpperBand=84,708.84,Channel_prd=73,660.09
66,275 65,018.9 64,278.4 62,611.4 66,540.6 67,869.9 73,660.1 73,660.1 79,450.3 84,708.8
Aug Sep Oct Nov Dec 2016 Feb Mar Apr May Jun Jul Aug Sep Oct
Optimization Trading System - ©2010
GGRM.JK-Volume=1,133,300.00,Avg.Volume=973,800.00
1,133,300 973,800
Aliran masuk dantrend naik volatilitas harga masih terlihat.
PadaFigure 12, terlihat dari hasil optimalisasi indikator MFI Optimized dan indikator W%R Optimized saat ini masih cenderung naik dengan volume tembus rata-rata. Hal ini mengindikasikan potensi kenaikkan masih terlihat.Resistance terdekat di 67,400 dan support level di 65,400. Stop loss level di 63,725.
Figure 12. Daily, MFI optimized & W%R optimized
Source: Daewoo Securities Indonesia Research
Created with AmiBroker - advanced charting and technical analysis software. http://www.amibroker.com GGRM.JK-MFI Smoothed=83.18
83.1761
GGRM.JK-Will%RSmoothed=-9.06
-9.05638
Optimization Trading System - ©2010 Optimization Trading System - ©2010 Optimization Trading System - ©2010
67,400 GGRM.JK-Daily10/19/2016Open66025, Hi 66425, Lo65725, Close66275(0.2%)VWAP=65,018.86,VWAP=66,540.62,VWAP=64,278.41
66,275 65,018.9 64,278.4 66,540.6
18 25 May 16 23 30 Jun 6 13 20 27 Jul 18 25 Aug 8 15 22 29 Sep 13 19 26 Oct 10 17
Optimization Trading System - ©2010
GGRM.JK-Volume=1,133,300.00,Avg.Volume=973,800.00
1,133,300 973,800
Harga akan coba bertahan sekitar rata-rata masing-masing periode.
Kenaikan harga saham ini diperkirakan masih terlihat, jika harga minimal mampu bertahan sekitar rata-rata masing-masing periode atau sekitar level 64,750-66,100 dengan target kenaikkan normal terdekat ke levelresistance 2 untuk masing-masing periode sebagaimana terlihat padaFigure 13,14 dan 15.
Figure 13. Daily,target : 66,950 Figure 14. Weekly,target : 67,550 Figure 15. Monthly,target : 68,325
Source: Daewoo Securities Indonesia Research Source: Daewoo Securities Indonesia Research Source: Daewoo Securities Indonesia Research
C r e a te d w ith A m iB r o ke r - a d v a n c e d c h a r tin g a n d te c h n ic a l a n a ly s is s o f tw a r e . h ttp ://w w w .a m ib r o ke r .c o m G G R M .J K - D a ily 1 0 /1 9 /2 0 1 6 O p e n 6 6 0 2 5 , H i 6 6 4 2 5 , L o 6 5 7 2 5 ,
6 6 ,2 7 5 6 6 ,1 1 2 .5 6 5 ,6 8 3 .9 6 5 ,2 5 5 .4 6 4 ,8 2 6 .8 6 4 ,3 9 8 .2 6 6 ,5 4 1 .1 6 6 ,9 6 9 .6 6 7 ,3 9 8 .2 6 7 ,8 2 6 .8
S e p O c t
O p tim iz a tio n T ra d in g S y ste m - © 2 0 1 0
G G R M .J K -V o lu m e= 1 ,1 3 3 ,3 0 0 .0 0 ,A v g .V o lu m e= 9 7 3 ,8 0 0 .0 0
1 ,1 3 3 ,3 0 0 9 7 3 ,8 0 0
C r e a te d w ith A m iB r o ke r - a d v a n c e d c h a r tin g a n d te c h n ic a l a n a ly s is s o f tw a r e . h ttp ://w w w .a m ib r o ke r .c o m G G R M .J K - W e e k ly 1 0 /1 9 /2 0 1 6 O p e n 6 4 8 5 0 , H i 6 6 4 2 5 , L o
6 6 ,2 7 5 6 5 ,4 1 2 .5 6 4 ,3 4 5 .7 6 3 ,2 7 8 .9 6 2 ,2 1 2 .2 6 1 ,1 4 5 .4 6 6 ,4 7 9 .3 6 7 ,5 4 6 .1 6 8 ,6 1 2 .8 6 9 ,6 7 9 .6
J u l O c t
O p tim iz a tio n T ra d in g S y ste m - © 2 0 1 0
G G R M .J K -V o lu m e= 2 ,7 6 0 ,3 0 0 .0 0 ,A v g .V o lu m e= 4 ,6 8 7 ,5 3 3 .5 0
2 ,7 6 0 ,3 0 0 4 ,6 8 7 ,5 3 4
Cr e a te d w ith A m iB r o ke r - a d v a n c e d c h a r tin g a n d te c h n ic a l a n a ly s is s o f tw a r e . h ttp ://w w w .a m ib r o ke r .c o m G G R M .J K - M o n th ly 1 0 /1 9 /2 0 1 6 O p e n 6 2 5 0 0 , H i 6 7 7 2 5 , L o
6 6 ,2 7 5 6 4 ,7 5 0 6 2 ,9 6 2 .7 6 1 ,1 7 5 .3 5 9 ,3 8 8 5 7 ,6 0 0 .7 6 6 ,5 3 7 .3 6 8 ,3 2 4 .7 7 0 ,1 1 2 7 1 ,8 9 9 .3
2 0 1 5 2 0 1 6
O p tim iz a tio n T ra d in g S y ste m - © 2 0 1 0
G G R M .J K -V o lu m e= 1 3 ,9 7 3 ,7 0 0 .0 0 ,A v g .V o lu m e= 2 7 ,1 6 7 ,9 0 0 .0 0
1 3 ,9 7 3 ,7 0 0 2 7 ,1 6 7 ,9 0 0
Gajah Tunggal (GJTL) – Trading Buy
Harga akan coba naik mendekatinormal lower band pada uptrend channel.
Secara umum harga saham ini juga masih bergerak dalam polauptrend yang masih relatif valid (r-squared = 0.8470 selama 189 hari terakhir dan bergerak normal dalam rentang +/- 1.55 std.deviasi dari centerline. Peluang harga keluar dari pergerakan normalnya sekitar 15.3 % (sekitar 29bar chart ). Volatilitas normal pergerakan harga saham ini sepanjanguptrend channel sebesar +/ 2.94 % atau sekitar +/- 38.24 (potensi naik dan turun secara normal maksimum/minimum sebesar 35-40 rupiah) dari level penutupan kemarin. Harga akan coba naik mendekatinormal lower band pada uptrend channel, sebagaimana terlihat pada Figure 16.
Summary
Item Data Item Data
Close (Oct 19 , 2016) 1,300(+2.8%)Trading range 1,255-1,365
Relative Avg. Price performance to JCI (%) 12.77Target
β (beta) 0.24 - Daily 1,320
Corelation 0.95 - Weekly 1,390
Period 189 - Monthly 1,620
r-squared 0.8470Stop loss 1,240
Volatility (+/-, %) 2.94
Volatility (+/-, Rp.) 38.24
Source: Daewoo Securities Indonesia Research Figure 16. Daily Trend - Uptrend
Source: Daewoo Securities Indonesia Research
Created with AmiBroker - advanced charting and technical analysis software. http://www.amibroker.com Optimization Trading System - ©2010
Optimization Trading System - ©2010 Optimization Trading System - ©2010 Optimization Trading System - ©2010
GJTL.JK-Daily10/19/2016Open1265, Hi 1300, Lo1255, Close1300(2.8%)UpperBand=1,837.44,Channel_prd=1,595.39,LowerBand=1,353.33,UpperBand=1,935.77,Channel_prd=1,595.39,Lower
1,300 1,292.11 1,255 1,353.33 1,363.36 1,595.39 1,595.39 1,837.44 1,935.77
2016 Feb Mar Apr May Jun Jul Aug Sep Oct
Optimization Trading System - ©2010
GJTL.JK-Volume=12,236,500.00,Avg.Volume=16,885,700.00
12,236,500 16,885,700
Aliran dana masuk dantrend naik volatilitas harga diperkirakan masih terlihat.
PadaFigure 17, terlihat dari hasil optimalisasi, indikator MFI Optimized dan indikator W%R Optimized cenderung naik dengan volume mendekati rata-rata. Hal ini mengindikasikan potensi kenaikkan masih terlihat lebih lanjut. Perkiraan resistance berikutnya di 1,350 sebelum lanjut ke 1,365.Support terdekat di 1,255 dan stop loss level di 1,240.
Figure 17. Daily MFI Optimized & W% Optimized
Source: Daewoo Securities Indonesia Research
Created with AmiBroker - advanced charting and technical analysis software. http://www.amibroker.com GJTL.JK-MFI Smoothed=44.16
44.1649
GJTL.JK-Will%RSmoothed=-84.04
-84.0376
Optimization Trading System - ©2010 Optimization Trading System - ©2010
1,240 GJTL.JK-Daily10/19/2016Open1265, Hi 1300, Lo1255, Close1300(2.8%)VWAP=1,363.36,VWAP=1,292.11
1,300 1,292.11 1,363.36
Mar Apr May Jun Jul Aug Sep Oct
Optimization Trading System - ©2010
GJTL.JK-Volume=12,236,500.00,Avg.Volume=16,885,700.00
12,236,500 16,885,700
Harga akan coba bertahan sekitar rata-rata periodedaily dan weekly.
Untuk mampu naik lebih lanjut harga saham ini harus mampu bertahan minimal sekitar rata-rata periode daily dan weekly atau sekitar level 1,280-1,300 dengan potensi kenaikan berikutnya keresistance 2 pada masing-masing periode sebagaimana terlihat padaFigure 18,19 dan 20.
Figure 18. Daily,target : 1,320 Figure 19. Weekly,target : 1,390 Figure 20. Monthly,target : 1,620
Source: Daewoo Securities Indonesia Research Source: Daewoo Securities Indonesia Research Source: Daewoo Securities Indonesia Research
analyzed by : Tasrul, [email protected], +62-21- 5151140
Relative Avg.Price Performance to JCI (%) : Persentase kenaikan harga saham dari rata-rata sejak IHSG memulaiuptrend-nya β (beta) : Indikator sensitivitas harga saham terhadap IHSG, beta diatas 1 berarti harga makin
sensitif terhadap pergerakan IHSG dan sebaliknya
Correlation : Ukuran kuat hubungan (korelasi) pergerakan harga saham dibanding dengan pergerakan IHSG
Period : Periodeuptrend / downtrend yang valid dari pergerakan harga saham
r-squared : Koefisien determinasi, menunjukkan persentase gerakan yang dapat dijelaskan dengan regresi linier.Nilai R2terletak antara 0 – 1, dan kecocokan model dikatakan lebih baik kalau R2semakin mendekati 1 (validitasuptrend atau downtrend makin valid) Volatility (+/-%) : Besaran volatilitas normal maksimal/minimal dari pergerakan harga harian selama
harga saham bergerak normal padatrend channel dalam persentase.
Volatility (+/- point or Rp) : Besaran volatilitas normal maksimal/minimal dari pergerakan harga harian selama Harga saham bergerak
Buy: : Beli, harga sudah menyentuh atau jatuh di bawahsupport dan indikator teknikal berada dioversold area.
Sell: : Jual, harga sudah menyentuh atau tembusresistance normal dan indikator berada dioverbought area.
BoW: :Buy on Weakness, beli ketika harga sudah melemah, dimana Volume tekanan jual mulai berkurang dan harga mendekati support, serta indikator teknikal sudah berada di oversold area.
SoS: :Sell on Strength, jual ketika kenaikan harga sudah mulai terbatas dimana volume beli mulai berkurang dan harga mendekati
resistance, serta indikator teknikal sudah berada di overbought area.
Trading Buy: : Beli dan jual kembali secepatnya jika harga sudah mencapai level resistance terdekat, karena kenaikan harga relatif tidak stabil atau hanya sementara.
Trading Sell : Jual dan beli kembali secepatnya jika harga sudah mencapai level support terdekat karena koreksi harga relative tidak stabil atau hanya sementara.
Cr e a te d w ith A m iB r o ke r - a d v a n c e d c h a r tin g a n d te c h n ic a l a n a ly s is s o f tw a r e . h ttp ://w w w .a m ib r o ke r .c o m G J T L .J K - W e e k ly 1 0 /1 9 /2 0 1 6 O p e n 1 3 1 5 , H i 1 3 4 5 , L o 1 2 5 5 ,
1 ,3 0 0 1 ,2 6 0 .0 1 1 ,2 1 6 .2 6 1 ,1 7 2 .5 2 1 ,1 2 8 .7 7 1 ,3 0 3 .7 5 1 ,3 4 7 .4 9 1 ,3 9 1 .2 4 1 ,4 3 4 .9 8 1 ,4 7 8 .7 3
J u l O c t
O p tim iz a tio n T ra d in g S y ste m - © 2 0 1 0 - P o w e re d b y A M T A G J T L .J K -V o lu m e= 3 6 ,8 9 6 ,5 0 0 .0 0 ,A v g .V o lu m e= 5 7 ,8 8 7 ,6 5 6 .0 0
3 6 ,8 9 6 ,5 0 0 5 7 ,8 8 7 ,6 5 6
Cr e a te d w ith A m iB r o ke r - a d v a n c e d c h a r tin g a n d te c h n ic a l a n a ly s is s o f tw a r e . h ttp ://w w w .a m ib r o ke r .c o m G J T L .J K - M o n th ly 1 0 /1 9 /2 0 1 6 O p e n 1 5 0 5 , H i 1 5 2 0 , L o 1 2 3 5 ,
1 ,3 0 0 1 ,2 7 4 .6 7 1 ,1 5 9 .3 3 1 ,0 4 4 9 2 8 .6 6 7 1 ,3 9 0 1 ,5 0 5 .3 3 1 ,6 2 0 .6 7 1 ,7 3 6 1 ,8 5 1 .3 3
2 0 1 5 2 0 1 6
O p tim iz a tio n T ra d in g S y ste m - © 2 0 1 0
G J T L .J K -V o lu m e= 1 6 0 ,2 3 7 ,3 9 2 .0 0 ,A v g .V o lu m e= 2 9 7 ,8 0 3 ,1 0 4 .0 0
1 6 0 ,2 3 7 ,3 9 2 2 9 7 ,8 0 3 ,1 0 4
Cr e a te d w ith A m iB r o ke r - a d v a n c e d c h a r tin g a n d te c h n ic a l a n a ly s is s o f tw a r e . h ttp ://w w w .a m ib r o ke r .c o m G J T L .J K - D a ily 1 0 /1 9 /2 0 1 6 O p e n 1 2 6 5 , H i 1 3 0 0 , L o 1 2 5 5 ,
1 ,3 0 0 1 ,2 9 9 .1 2 1 ,2 8 0 1 ,2 6 0 .8 8 1 ,2 4 1 .7 6 1 ,2 2 2 .6 4 1 ,2 0 3 .5 2 1 ,3 1 8 .2 4 1 ,3 3 7 .3 6 1 ,3 5 6 .4 8
S e p O c t
O p tim iz a tio n T ra d in g S y ste m - © 2 0 1 0
G J T L .J K -V o lu m e= 1 2 ,2 3 6 ,5 0 0 .0 0 ,A v g .V o lu m e= 1 6 ,8 8 5 ,7 0 0 .0 0
1 2 ,2 3 6 ,5 0 0 1 6 ,8 8 5 ,7 0 0
Chart 21. JCI Vs. USD/IDR Chart 22. JCI performance (absolute vs. relative)
Source: Bloomberg, Daewoo Securities Indonesia Research Note: Relative to MSCI EM Index
Source: Bloomberg, Daewoo Securities Indonesia Research
Chart 23. Foreigner’s net purchase (EM) Chart 24. Energy price
Note: The latest figure for India are Oct, 18th
Source: Bloomberg, Daewoo Securities Indonesia Research Source: Bloomberg, Daewoo Securities Indonesia Research
Chart 25. Non-ferrous metal price Chart 26. Precious metal price
Source: Bloomberg, Daewoo Securities Indonesia Research Source: Bloomberg, Daewoo Securities Indonesia Research 12,800
13,000 13,200 13,400 13,600 13,800 14,000
4,300 4,500 4,700 4,900 5,100 5,300 5,500 5,700
7/20 8/3 8/17 8/31 9/14 9/28 10/12
(IDR)
(pt) JCI (L) USD/IDR (R)
-0.4
0.8 2.0
18.0
-0.9 -1.7
0.4
12.3
-4 0 4 8 12 16 20
1D 1W 1M 1Y
Absolute Relative (%, %p)
195 181
-5 -73
22 56
691
-49
-153
-388 -13
-318 -600
-400 -200 0 200 400 600 800
Korea Taiwan Indonesia Thailand Philippines India
1 Day 5 Days
(USDmn) (USDmn) (USDmn) (USDmn)
70 80 90 100 110 120 130 140 150 160
7/16 8/16 8/16 8/16 9/16 9/16 10/16
CPO WTI Coal
(((D-3M=100)
80 90 100 110 120
7/16 8/16 8/16 8/16 9/16 9/16 10/16
(D-3M=100) Copper Nickel Tin
((
80 85 90 95 100 105 110
7/16 8/16 8/16 8/16 9/16 9/16 10/16
Silver Gold Platinum
Table. Key valuation metrics
Company Name Ticker Price Market Cap Price Performance (%) P/E(X)* P/B(X)* ROE(%)*
(IDR) (IDRbn) 1D 1W 1M 1Y FY16 FY17 FY16 FY17 FY16 FY17
Jakarta Composite Index JCI 5,409 5,867,197 -0.4 0.8 1.6 18.4
FINANCIALS
Bank Central Asia BBCA 15,975 393,864 -0.5 2.4 4.8 21.7 17.8 15.8 3.2 2.7 18.8 18.2
Bank Mandiri Persero BMRI 11,375 265,417 -0.2 3.4 1.3 24.3 12.3 10.7 1.6 1.5 14.1 14.4
Bank Rakyat Indonesia Persero BBRI 12,150 299,730 -0.4 1.3 2.5 16.5 10.4 9.1 1.9 1.6 19.1 19.0
Bank Negara Indonesia Persero BBNI 5,400 100,703 0.0 4.3 1.9 5.4 8.1 6.8 1.1 1.0 13.8 14.5
Bank Tabungan Negara Persero BBTN 1,920 20,333 0.0 0.3 -1.8 62.7 10.4 9.0 1.0 0.9 9.5 10.2
CONSUMER
HM Sampoerna HMSP 4,080 474,578 -1.2 1.5 -0.7 16.8 35.6 31.6 12.8 11.2 37.4 39.1
Gudang Garam GGRM 66,275 127,519 0.2 3.2 1.9 52.5 16.8 14.7 2.8 2.5 17.6 17.9
Indofood CBP Sukses Makmur ICBP 9,450 110,205 -0.8 -3.6 -2.6 41.8 27.2 24.0 5.6 5.1 21.4 21.7
Indofood Sukses Makmur INDF 8,550 75,073 -1.2 -4.2 1.8 33.6 16.8 14.4 2.3 2.1 15.2 15.8
Kalbe Farma KLBF 1,730 81,094 -0.3 1.2 1.8 19.3 31.8 28.4 6.1 5.6 20.1 20.5
Unilever Indonesia UNVR 44,325 338,200 -0.3 -1.5 -0.1 15.7 46.4 41.1 57.6 53.1 130.3 137.5
AGRICULTURAL
Astra Agro Lestari AALI 15,800 30,410 -0.9 5.3 -1.4 -12.3 15.9 14.0 1.8 1.6 11.4 12.0
PP London Sumatera Indonesia LSIP 1,545 10,541 -2.5 3.3 -1.6 11.2 14.5 12.9 1.3 1.2 9.0 9.5
Sawit Sumbermas Sarana SSMS 1,440 13,716 -1.4 -4.6 -12.7 -23.8 16.8 12.2 3.4 2.8 20.9 22.0
INFRASTRUCTURE
XL Axiata EXCL 2,360 25,224 -2.5 -9.6 -9.2 -26.6 21.3 14.4 1.1 1.0 3.9 5.9
Jasa Marga JSMR 4,520 30,736 -1.5 -2.0 -6.4 -18.6 18.1 19.3 2.4 2.2 12.5 11.5
Perusahaan Gas Negara PGAS 2,500 60,604 -2.7 -3.1 -8.8 -17.2 10.7 10.1 1.3 1.2 13.4 12.7
Tower Bersama Infrastructure TBIG 6,100 29,259 0.0 -0.4 3.8 -9.6 18.6 15.9 6.4 5.4 40.8 37.8
Telekomunikasi Indonesia TLKM 4,200 423,360 -0.7 1.4 0.0 55.1 18.6 16.9 4.4 4.0 23.1 23.9
Soechi Lines SOCI 416 2,937 0.0 0.5 -1.0 -15.1 4.0 4.6 0.6 0.6 12.8 12.9
Garuda Indonesia GIAA 396 10,244 0.0 -1.0 -6.2 25.3 17.7 11.9 2.3 2.1 11.9 16.4
BASIC-INDUSTRIES
Semen Indonesia SMGR 9,975 59,167 -0.7 -0.7 -1.5 -6.1 13.0 11.7 1.9 1.7 15.0 15.2
Charoen Pokphand Indonesia CPIN 3,570 58,541 -3.5 -3.5 -0.6 40.3 17.2 14.0 3.4 2.9 21.4 21.8
Indocement Tunggal Prakarsa INTP 16,800 61,845 -0.4 -3.7 -2.9 -11.1 14.5 13.2 2.2 2.0 15.2 15.8
Japfa Comfeed Indonesia JPFA 1,715 19,569 -2.0 -0.3 11.7 294.3 12.9 11.4 2.2 2.0 17.7 19.8
MINING
Indo Tambangraya Megah ITMG 14,050 15,875 4.1 1.1 33.2 42.6 11.1 10.2 1.4 1.3 12.8 13.8
Adaro Energy ADRO 1,530 48,939 6.3 8.9 29.1 137.2 16.8 14.7 1.2 1.2 6.8 7.3
Aneka Tambang ANTM 825 19,825 -0.6 -1.8 32.0 94.6 N/A 74.8 1.1 1.2 0.5 1.2
Vale Indonesia INCO 2,850 28,319 -1.4 3.3 7.1 25.0 54.8 27.4 1.2 1.2 2.3 4.3
Tambang Batubara Bukit Asam PTBA 12,525 28,859 2.7 7.7 29.5 89.1 11.9 11.5 2.3 2.1 20.3 19.2
TRADE
United Tractors UNTR 20,100 74,976 1.5 5.2 12.8 2.4 14.7 13.8 1.8 1.6 12.2 12.3
AKR Corporindo AKRA 6,900 27,543 1.1 9.1 5.3 14.5 19.9 17.4 3.5 3.1 18.6 18.9
Global Mediacom BMTR 875 12,424 2.9 1.7 0.6 -13.4 11.6 8.8 N/A N/A N/A N/A
Matahari Department Store LPPF 18,925 55,222 -0.9 7.7 -3.2 16.1 21.7 19.4 19.1 14.6 98.6 81.3
Media Nusantara Citra MNCN 2,120 30,265 1.0 8.4 11.0 25.4 15.5 13.6 2.7 2.4 18.0 18.8
Matahari Putra Prima MPPA 1,820 9,788 -1.9 0.6 0.6 -30.1 28.9 30.4 3.3 3.0 9.6 9.1
Surya Citra Media SCMA 2,600 38,016 -1.1 0.0 -9.1 -16.9 20.4 18.0 8.7 7.5 47.0 46.1
Siloam International Hospital SILO 10,625 12,284 -2.7 3.2 2.2 -12.0 89.8 67.1 6.0 5.7 6.5 7.3
PROPERTY
Bumi Serpong Damai BSDE 2,220 42,728 -0.4 1.8 4.7 31.8 16.1 14.1 1.8 1.6 11.8 12.3
Adhi Karya ADHI 2,320 8,261 -1.7 0.0 -8.3 12.3 10.3 7.9 1.3 1.1 13.0 15.1
Alam Sutera Realty ASRI 458 8,999 -2.1 1.3 -4.2 19.0 9.2 6.6 1.1 1.0 11.7 15.6
Ciputra Development CTRA 1,610 24,835 0.6 1.9 1.9 57.3 17.3 13.9 2.4 2.1 15.0 15.9
Lippo Karawaci LPKR 920 21,231 -1.1 -4.7 -13.6 -28.7 14.7 13.5 1.1 1.0 8.7 8.8
Pembangunan Perumahan PTPP 4,200 20,338 0.0 0.7 -6.7 13.8 16.9 13.5 3.3 2.8 21.2 22.2
Pakuwon Jati PWON 715 34,434 0.7 4.4 10.9 81.5 14.7 11.5 3.1 2.5 23.3 24.5
Summarecon Agung SMRA 1,745 25,175 -0.6 -1.4 5.1 24.6 30.3 24.9 3.3 3.1 12.6 13.5
Wijaya Karya WIKA 2,700 16,603 -1.5 -1.8 -3.9 -9.2 16.3 12.9 2.7 2.4 17.4 19.4
Waskita Karya WSKT 2,610 35,426 -1.1 -2.2 -3.3 61.1 18.1 13.5 2.9 2.4 16.9 18.0
MISCELLANEOUS
Astra International ASII 8,375 339,050 -1.2 0.9 1.8 28.8 18.0 16.4 2.7 2.5 15.6 15.6
Source: Bloomberg, Daewoo Securities Indonesia Research
*Note: Valuation metrics based on Bloomberg consensus estimates
Sector performance Top 10 market cap performance
Name Index Chg (%) Ticker Price Market Cap (IDRbn) Chg (%)
Agricultural 1,818.7 -1.0 BRPT IJ 1295 9,039 14.1
Mining 1,280.5 1.7 ADRO IJ 1530 48,939 6.25
Basic-Industry 530.1 -0.3 RALS IJ 1290 9,154 4.88
Miscellaneous Industry 1,386.5 -0.9 EMTK IJ 8800 49,632 4.76
Consumer Goods 2,493.6 -0.8 ITMG IJ 14050 15,875 4.07
Property & Construction 565.6 -0.5 BMTR IJ 875 12,424 2.94
Infrastructure 1,099.1 -0.8 TPIA IJ 17600 57,851 2.9
Finance 805.2 -0.3 PTBA IJ 12525 28,859 2.66
Trade 857.4 0.4 BSIM IJ 780 11,853 2.6
Composite 5,409.3 -0.4 SMBR IJ 1920 18,888 2.13
Source: Bloomberg
Top 5 leading movers Top 5 lagging movers
Name Chg (%) Close Name Chg (%) Close
ADRO IJ 6.3 1,530 HMSP IJ -1.2 4,080
EMTK IJ 4.8 8,800 ASII IJ -1.2 8,375
TPIA IJ 2.9 17,600 TLKM IJ -0.7 4,200
UNTR IJ 1.5 20,100 CPIN IJ -3.5 3,570
BRPT IJ 14.1 1,295 BBCA IJ -0.5 15,975
Source: Bloomberg
Economic Calendar
Time Currency Detail Forecast Previous
12:00am GBP MPC Member Haldane Speaks
1:00am USD Beige Book
3:15am CAD BOC Gov Poloz Speaks
6:45am USD FOMC Member Dudley Speaks
7:30am AUD Employment Change 15.2K -3.9K
7:30am AUD Unemployment Rate 5.7% 5.6%
7:30am AUD NAB Quarterly Business Confidence 2
1:00pm CHF Trade Balance 3.27B 3.02B
1:00pm EUR German PPI m/m 0.3% -0.1%
3:00pm EUR Current Account 24.3B 21.0B
3:30pm GBP Retail Sales m/m 0.3% -0.2%
Tentative EUR Spanish 10-y Bond Auction 1.07|1.8
Day 1 EUR EU Economic Summit
6:45pm EUR Minimum Bid Rate 0.00% 0.00%
7:00pm GBP MPC Member Shafik Speaks
7:30pm EUR ECB Press Conference
7:30pm USD Philly Fed Manufacturing Index 5.2 12.8
7:30pm USD Unemployment Claims 251K 246K
9:00pm USD Existing Home Sales 5.36M 5.33M
9:00pm USD CB Leading Index m/m 0.2% -0.2%
9:30pm USD Natural Gas Storage 79B
Note: Time is based on Indonesian local time Source: Forex Factory
Disclaimers
This report is prepared strictly for private circulation only to clients of PT Daewoo Securities Indonesia (DWS). It is purposed only to person having professional experience in matters relating to investments. The information contained in this report has been taken from sources which we deem reliable. No warranty (express or implied) is made to the accuracy or completeness of the information. All opinions and estimates included in this report constitute our judgments as of this date, without regards to its fairness, and are subject to change without notice. However, none of DWS and/or its affiliated companies and/or their respective employees and/or agents makes any representation or warranty (express or implied) or accepts any responsibility or liability as to, or in relation to, the accuracy or completeness of the information and opinions contained in this report or as to any information contained in this report or any other such information or opinions remaining unchanged after the issue thereof. We expressly disclaim any responsibility or liability (express or implied) of DWS, its affiliated companies and their respective employees and agents whatsoever and howsoever arising (including, without limitation for any claims, proceedings, action, suits, losses, expenses, damages or costs) which may be brought against or suffered by any person as a results of acting in reliance upon the whole or any part of the contents of this report and neither DWS, its affiliated companies or their respective employees or agents accepts liability for any errors, omissions or misstatements, negligent or otherwise, in the report and any liability in respect of the report or any inaccuracy therein or omission there from which might otherwise arise is hereby expresses disclaimed.
This document is not an offer to sell or a solicitation to buy any securities. This firms and its affiliates and their officers and employees may have a position, make markets, act as principal or engage in transaction in securities or related investments of any company mentioned herein, may perform services for or solicit business from any company mentioned herein, and may have acted upon or used any of the recommendations herein before they have been provided to you. © PT Daewoo Securities Indonesia 2015.